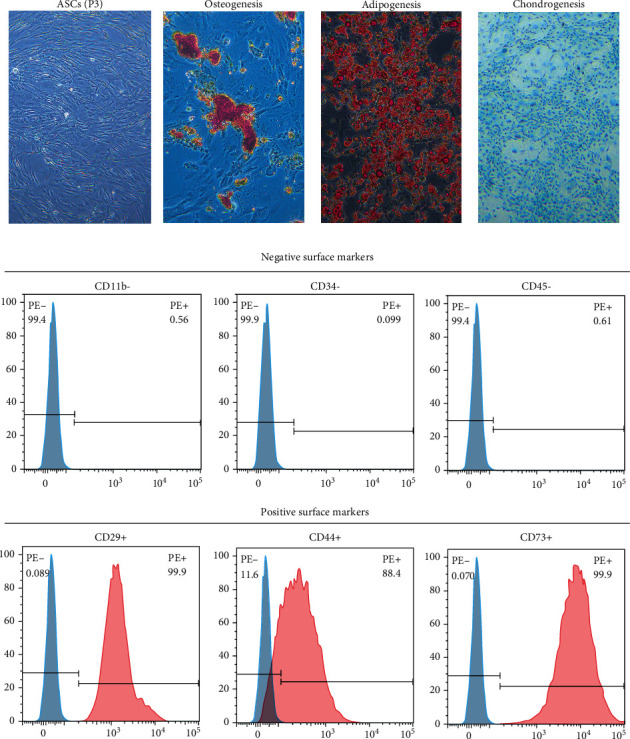
Figure 2.

Isolation and identification of ADSCs. (a) The morphology of the isolated ADSCs from rat at passage 2. Bar = 100 μm. (b) Osteogenic differentiation, chondrogenic differentiation, and adipogenic differentiation of ADSCs revealed by Alizarin Red, Alcian blue, and Oil red O staining. Bar = 100 μm. (c) The expression of cell surface markers related to stem cell phenotype in ADSCs using flow cytometry analysis, which were positive for CD29, CD44, and CD73 and negative for CD11b, CD34, and CD45.
