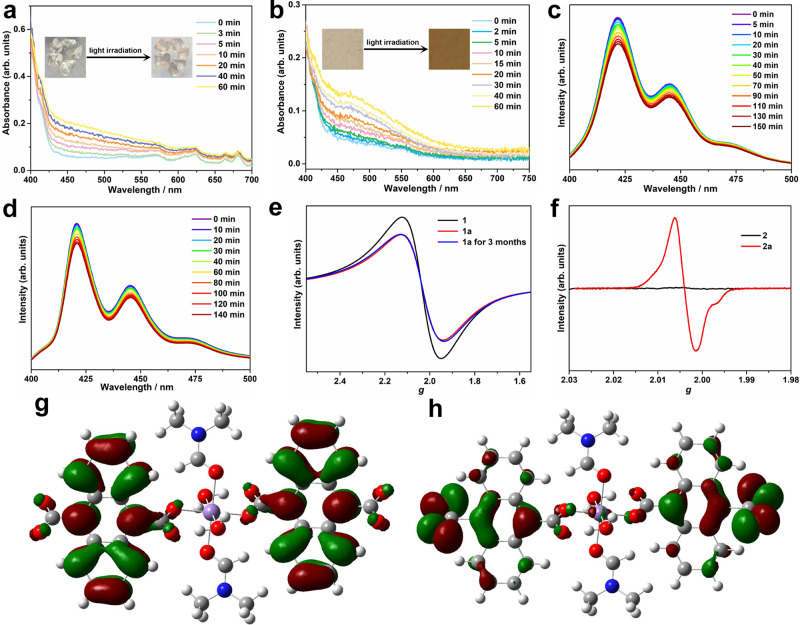
Fig. 2. Characterization and mechanism of photochromism.
Time-dependent UV–Vis spectra of 1 (a) and 2 (b) upon irradiation. Insert: photos of color changes for crystal samples 1 and powder samples 2; time-dependent photoluminescent spectra of 1 (c) and 2 (d) excited at 283 nm; room temperature ESR spectra of 1 (e) and 2 (f) under a frequency of 9.84 GHz before and after light irradiation; the calculated spatial distributions of HOMO (g) and LUMO (h) of 1 at the B3LYP/6-311G(d) level.

