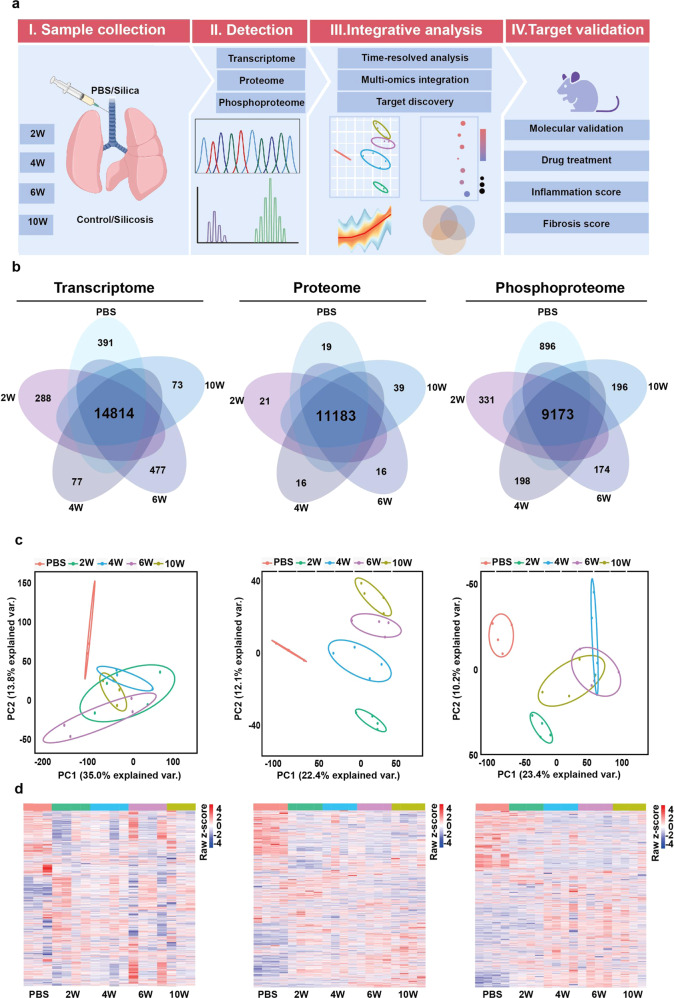
Fig. 1.
Multi-omics profiling of the silicosis mouse lungs. a The flow chart depicted the experimental procedures and data analysis workflow. b Venn diagrams showed the overlapped features including 4,745 mRNA, 11,294 proteins and 10,968 phosphosites among samples collected from silicosis model in different stages. c Principle component analysis (PCA) scatter plots were performed with all identified features to explore the largest sources of variance within each omics dataset. d Heatmaps of differentially expressed features in transcriptome, proteome, and phosphoproteome. 2W, 2 weeks; 4W, 4 weeks; 6W, 6 weeks, 10W, 10 weeks. The color bars in the heatmaps right represented the gene expression level (blue, downregulation and red, upregulation)

