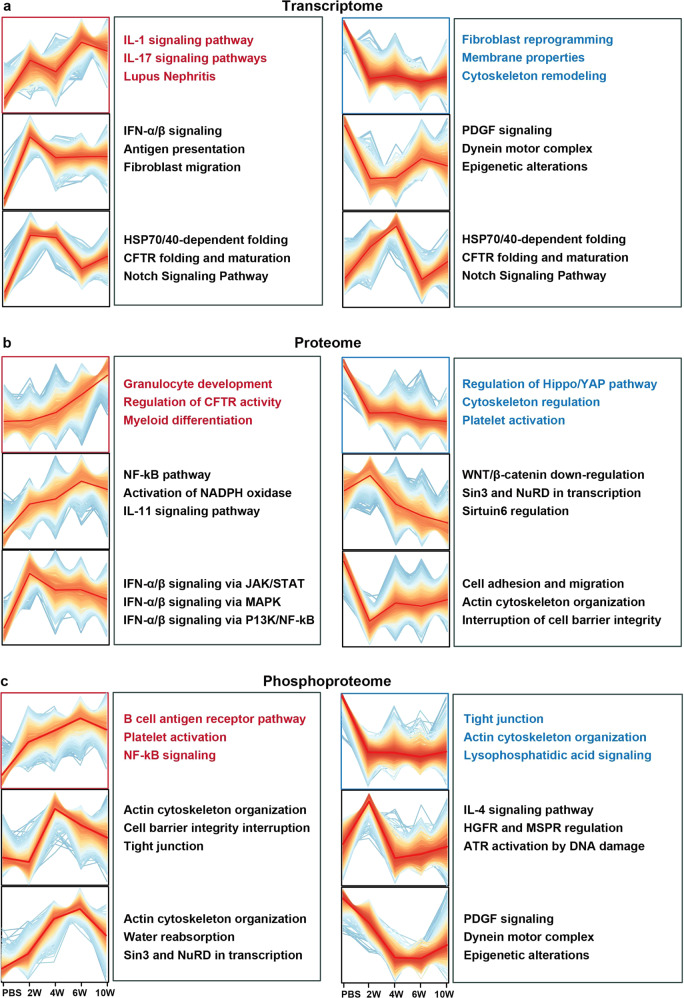
Fig. 2.
Trend analysis of silicosis progression in five groups (PBS, 2W, 4W, 6W, 10W). a 4340 mRNA, b 4482 proteins, and c 5052 phospho sites were clustered with fuzzy c-means clustering into 6 discrete expression clusters respectively to illustrate the relative expression changes of the transcriptomic, proteomic and phosphoproteomic data along the progression of the disease in mouse model, and the top 3 pathways enriched for each cluster in metacore were provided alongside the clusters. Key pathways highlighted in red were proposed to be consistently upregulated in silicosis among multi-omics datasets, while essential pathways highlighted in blue proposed to be consistently downregulated in silicosis among multi-omics datasets. 2W, 2 weeks; 4W, 4 weeks; 6W, 6 weeks, 10W, 10 weeks

