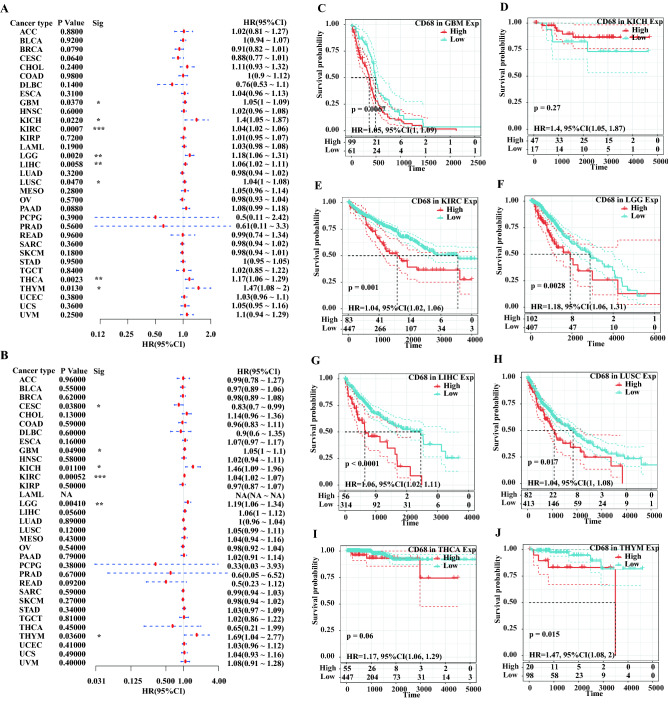
Figure 3.
Survival analysis of CD68 in pan-cancer from the TCGA database. Forest plot compared the prognostic value of CD68 on OS (A) and DSS (B) across pan-cancer. Kaplan–Meier Method displayed the prognostic value of CD68 on OS in GBM (C), KICH (D), KIRC (E), LGG (F), LIHC (G), LUSC (H), THCA (I), THYM (J). The cut-off points are 61.89% (GBM), 73.44% (KICH), 15.66% (KIRC), 20.04% (LGG), 15.14% (LIHC), 16.57% (LUSC), 10.96% (THCA), 16.95% (THYM). *P < 0.05, **P < 0.01, ***P < 0.001.

