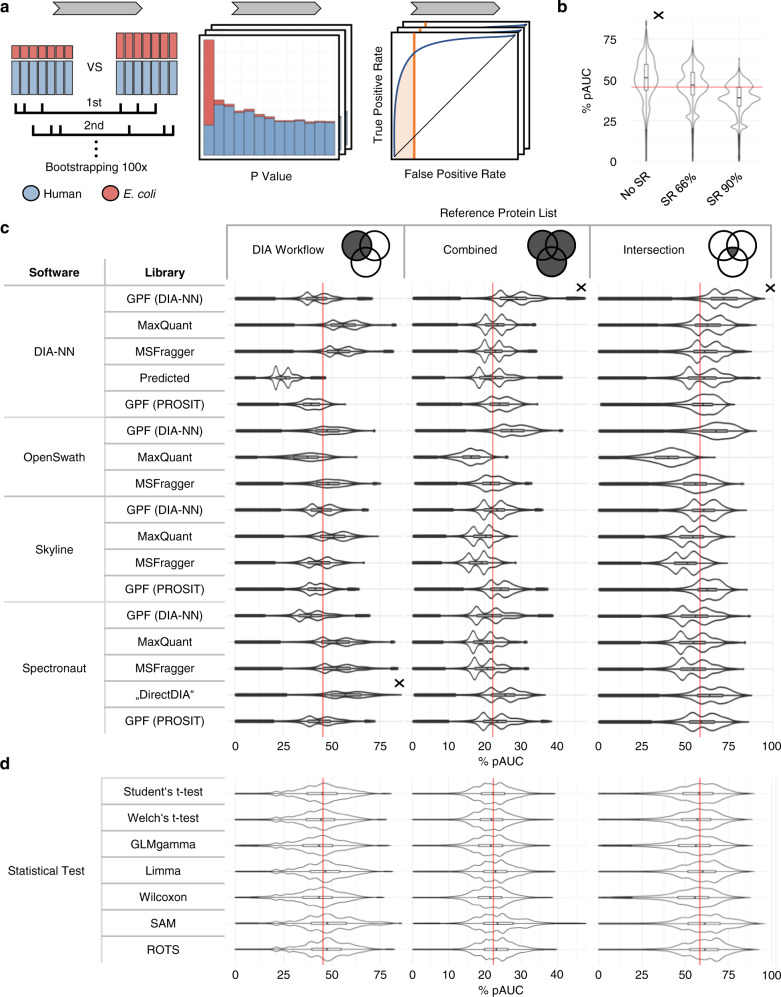
Fig. 4. Statistical analysis of benchmark dataset.
a Workflow schematic: for the generation of bootstrap datasets, random samples were drawn with replacement from samples of spike-in conditions 1:25 and 1:12 mimicking two groups containing differentially abundant proteins, here represented by all E. coli proteins. The p-values acquired after data preprocessing and statistical analysis were used to build receiver operating characteristic (ROC) curves. The partial area under the curve (pAUC) was used as a measure of prediction performance. b pAUC distribution for the different sparsity reduction options (as measured against ‘DIA Workflow’ protein list). c pAUC for the different DIA analysis workflows as measured against the three reference protein lists. d pAUC distributions for the statistical tests. All seven statistical tests were two-sided and not adjusted for multiple testing. ‘DIA Workflow’ describes the performance against the proteins present in the given DIA workflow only, ‘Combined’ describes the performance against proteins identified at least by one of all DIA analysis workflows. ‘Intersection’ describes the performance against proteins which were found in >80% (in at least 14 of 17) of the DIA analysis workflows. For each reference protein list, the respective median of all pAUC values is indicated by a red line, and the best performing option with a cross. b–d are based on n = 2100 bootstrap datasets which have been generated by drawing with replacement from data of n = 23 biologically independent samples of spike-in conditions 1:12 and 1:25, respectively. The sample size of these bootstrap datasets ranged from 3 to 23 samples, which due to drawing with replacement can appear multiple times. For c that comes to a total of n = 2100 * 17 DIA workflows * 4 normalizations * 7 statistical tests = 999600 data points per sparsity reduction setting, for c to a total of n = 2100 * 3 sparsity reductions * 7 statistical tests = 176400 per library-software combination, and for d to a total of n = 2100 * 17 DIA workflows * 3 sparsity reductions * 4 normalizations = 428400 per statistical test setting. The boxplots show median (center line), interquartile range (IQR, extending from the first to the third quartile) (box), and 1.5 * IQR (whiskers).

