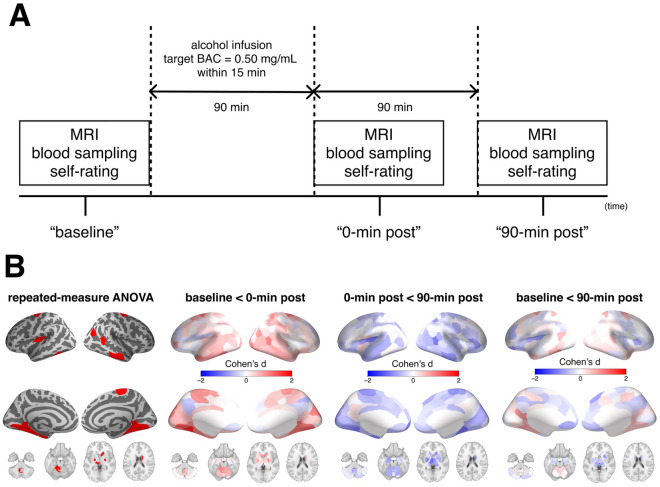
Figure 1.
Experimental design and the effect on functional connectivity. Panel (A) represents the experimental design of the present study. Panel (B) represents differences of log-transformed local functional connectivity density across the conditions. The leftmost column of the panel shows regions which have significant differences across the conditions revealed by repeated-measure ANOVA. The others show regional effect sizes (Cohen’s d) of the differences of log-transformed local functional connectivity density between the conditions. These maps are visualized using pysurfer (0.10) (https://github.com/nipy/PySurfer). ANOVA analysis of variance, BAC blood alcohol concentration.

