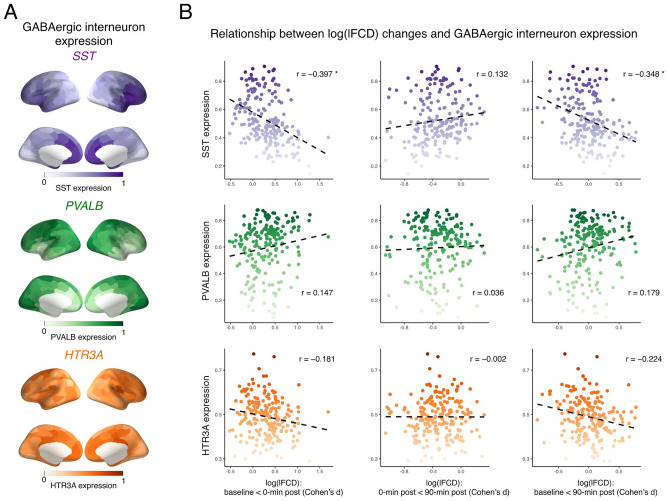
Figure 2.
Correlation between alcohol-induced changes in functional connectivity and cortical expression maps specific to GABAergic interneuron subtypes. Panel (A) shows distributions of cortical expression of each GABAergic interneuron subtype. These cortical expression data are visualized using pysurfer (0.10) (https://github.com/nipy/PySurfer). Panel (B) shows spatial relationships between log(lFCD) changes across conditions and cortical gene expression specific to each GABAergic interneuron subtype. *PFDR < 0.05. HTR3A 5-hydroxytryptamine 3a receptor, lFCD local functional connectivity density, GABA gamma-aminobutyric acid, PVALB parvalbumin, SST somatostatin.

