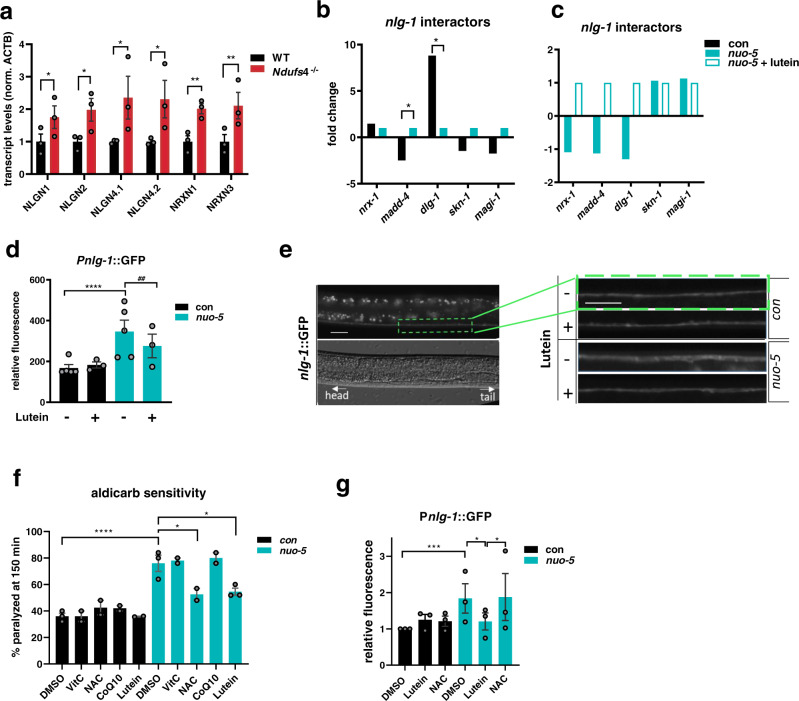
Fig. 7. Upregulation of neuroligin and neurexin genes upon nuo-5 is conserved across species and the defect is rescued by lutein but no other antioxidants.
a Expression levels of neuroligin (NLGN1-2 and 4) and neurexin (NRX1 and 3) transcripts in brains of NDUFS4−/− mice compared to healthy animals normalized to ACTB, assessed by qPCR. Three biologically independent experiments, n = 3. NLGN1 p = 0.0245, NLGN2 p = 0.019, NLGN4.1 p = 0.0179, NLGN4.2 p = 0.0104, NRXN1 p = 0.0013, NRXN3 p = 0.0068. b, c Fold change of genes described as nlg-1 interactors (from microarray data). d Quantification of GFP expression of pnlg-1 transgenic strain. Box plots indicate median (middle line), 25th, 75th percentile (box) and 5th and 95th percentile (whiskers) as well as outliers (single points). n ≥ 47 over three biologically independent experiments. con vs nuo-5 p < 0.0001, nuo-5 vs nuo-5 + lutein p = 0.0023. e Representative pictures of pnlg-1::GFP in ventral nerve cord. Scale bar 10 µm. Three biologically independent experiments with similar results. f Sensitivity to Aldicarb is shown as percentage of paralyzed animals after 150 minutes on plates containing 0.5 mM Aldicarb. Bar graphs represent means ± SEM and corresponding data points. n ≥ 50 in two biologically independent experiments for VitC, NAC, CoQ10 and three biologically independent experiments for DMSO and lutein. con DMSO vs nuo-5 DMSO p < 0.0001, nuo-5 DMSO vs nuo-5 NAC p = 0.029, nuo-5 DMSO vs nuo-5 lutein p = 0.024. g Quantification of GFP expression in Pnlg-1::gfp transgenic strain. Box plots indicate median (middle line), 25th, 75th percentile (box) and 5th and 95th percentile (whiskers) as well as outliers (single points). n ≥ 36 over three biologically independent experiments. con vs nuo-5 DMSO p = 0.0004, nuo-5 DMSO vs nuo-5 lutein p = 0.025, nuo-5 lutein vs nuo-5 NAC p = 0.0172. One-way ANOVA, bar graphs represent means ± SEM, asterisks (*) denote significant differences vs control, # denote differences among conditions. Data for all panels are provided as a Source Data file.

