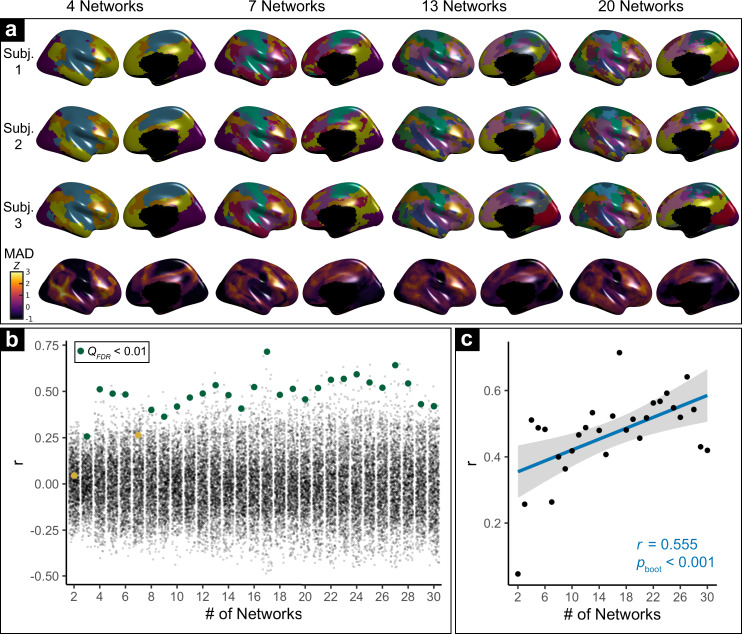
Fig. 2. Variability in personalized networks across scales.
a Variability in personalized networks is greatest in association cortex across scales. Exemplar personalized networks at scales 4, 7, 13, and 20 are shown for three participants. Prominent individual differences in functional topography are present at all scales, as quantified by median absolute deviation (MAD) of functional network loadings across participants (bottom row, z-scored within each scale). b Variability of functional topography aligns with functional hierarchy. Spin-tests of the correlation between topographic variability and the principal functional connectivity gradient17 at each scale reveal that variability is significantly correlated with a sensorimotor-to-association hierarchy at most scales (green dots = significant correlations; yellow dots = non-significant correlations; black dots = spin-test null correlations, FDR false discovery rate). c Greater alignment between a sensorimotor-to-association hierarchy and topographic variability is present at finer scales. Scatterplot depicts second-order correlation of variability (MAD) and the principal gradient (from b) across scales. The statistical test is two-sided. Error bands depict the 95% confidence interval.

