Figure 1.
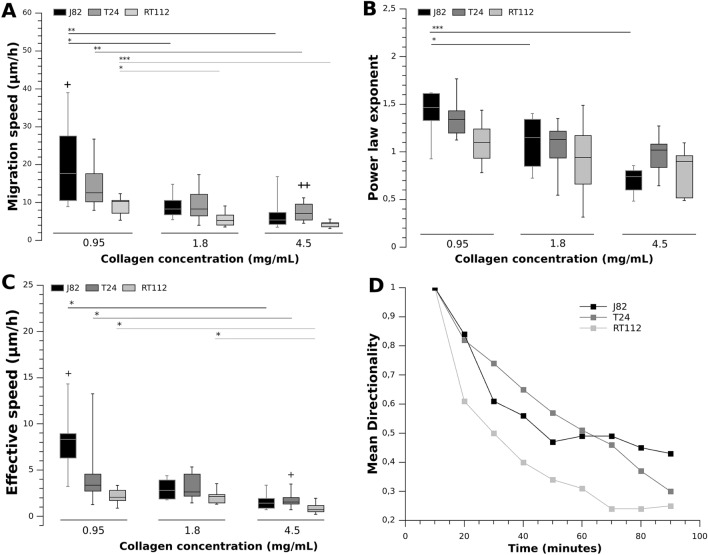
Effect of cell metastatic potential and collagen concentration on (A) migration speed, (B) power law exponent, (C) cell effective speed, (D) Mean directionality (at 0.95 mg/mL). Three cancer cell lines of increasing invasiveness (RT112 < T24 < J82) and collagen gel concentration (0.95 mg/mL, 1.8 mg/mL and 4.5 mg/mL) were used. Power-law exponents in (B) were obtained from MSD(t) = D . Box-whisker plots indicate median value, 25% and 75% quartiles and whiskers extend to the 5% and 95% percentiles (A–C). Statistical significance from another collagen concentration * corresponds to p < 0.05, ** corresponds to p < 0.01, *** corresponds to p < 0.001. Significant difference (+) from RT112 cells (+ p < 0.05, ++ p < 0.01). Cell number: (A) and (C) For 0.95 mg/mL, N = 9, 10, 7 respectively for J82, T24, RT112 cells. For 1.8 mg/mL, N = 8, 9, 7. For 4.5 mg/mL, N = 10, 13, 9. (B) For 0.95 mg/mL, N = 8, 9, 7 respectively for J82, T24, RT112 cells. For 1.8 mg/mL, N = 7, 8, 7. For 4.5 mg/mL, N = 8, 9, 9. (D) Graph representing the mean directionality vs. time for the three cancer cell lines at 0.95 mg/mL.

