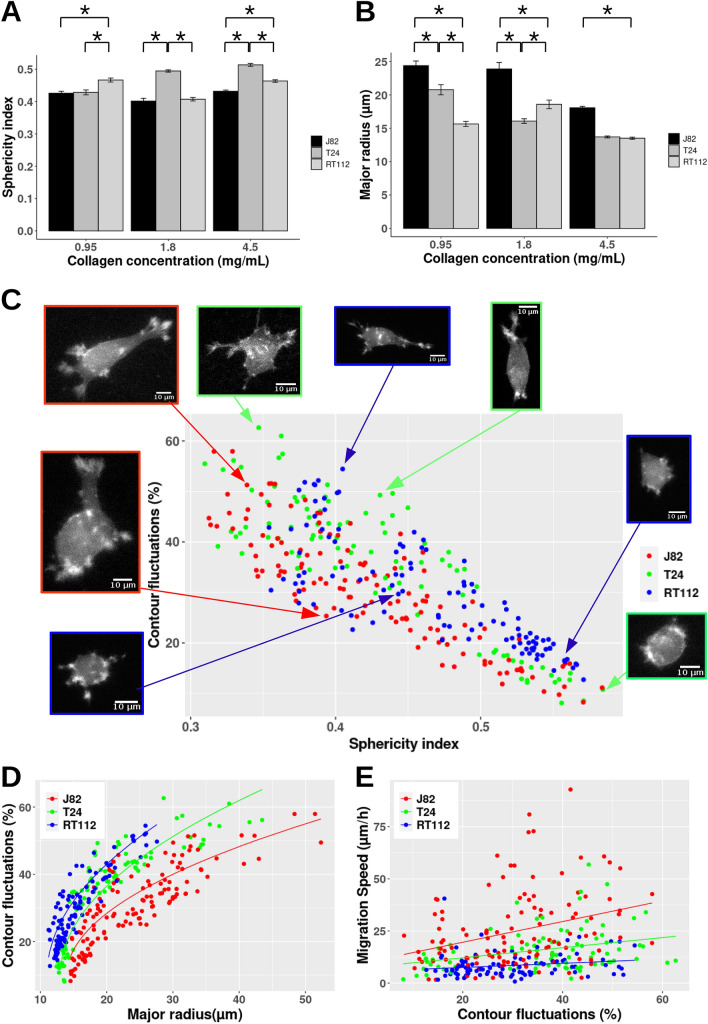
Figure 2.
(A) Mean sphericity index () for different cancer cells (RT112, T24 and J82) in various collagen gels (0.95 mg/mL to 1.8–4.5 mg/mL). *p < 0.05 (Kruskal Wallis test). Error bars represent mean ± SEM. (B) Mean major radius (R) of different cancer cells at low, intermediate and high collagen concentrations. (C) Graph representing contour fluctuations () vs. sphericity index . Insets show various shapes used by cancer cells of various invasiveness (blue for RT112 cells, green for T24 cells, red for J82 cells). (D) graph of contour fluctuations () vs. major radius (R) in μm. Solid line: power fit of = A + B * (R − C) with A = 10, 10, 10; B = 7.5, 10, 11; C = 14, 13, 11 respectively for J82, T24 and RT112 cells. (E) Migration speed (V) vs. contour fluctuations (). Fits V = a* + b with a = 0.5, 0.25, 0.1 μm/h; b = 9.6, 7.3, 5.5 μm/h, for J82, T24 and RT112 cells.

