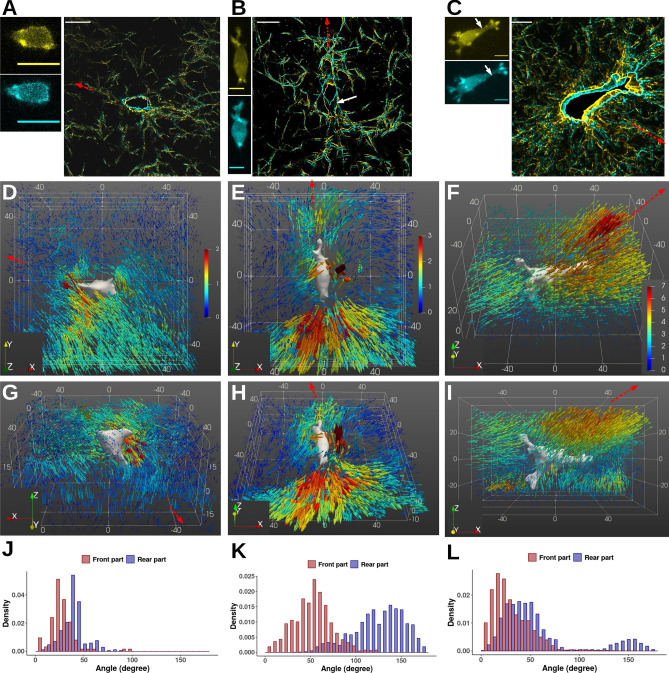
Figure 3.
Boxes (A–C): Z-projections (left panels) of confocal fluorescence images of the actin cytoskeleton for three migrating bladder cancer cells (RT112, T24 and J82 respectively) embedded in a 0.95 mg/mL collagen gel, at 10 min time interval (first position in yellow, second one in cyan). Superposition of collagen fiber images (right panels) at these times, for one slice level in the image stack, with indication of cell contours. Scale bar = 20 μm. The white arrow indicates the rear of the T24 cell (B) or the long cylindrical protrusion displayed by the J82 cell (C). The red dotted arrow indicates the migration direction. Boxes (D–I): Corresponding 3D collagen fiber displacements around each migrating bladder cancer cells: RT112 (D,G), T24 (E,H), J82 (F,I). Two viewing angles have been selected. The initial 3D cell shape is shown in grey levels. The vector length and color indicate the displacement magnitude in μm. The x, y and z grids are in μm. The red dotted arrow indicates the migration direction. (J–L) Angle distributions of displacement vectors—with respect to the direction of migration—shown in red (resp. blue) for vectors located at the front (resp. at the rear) edge.

