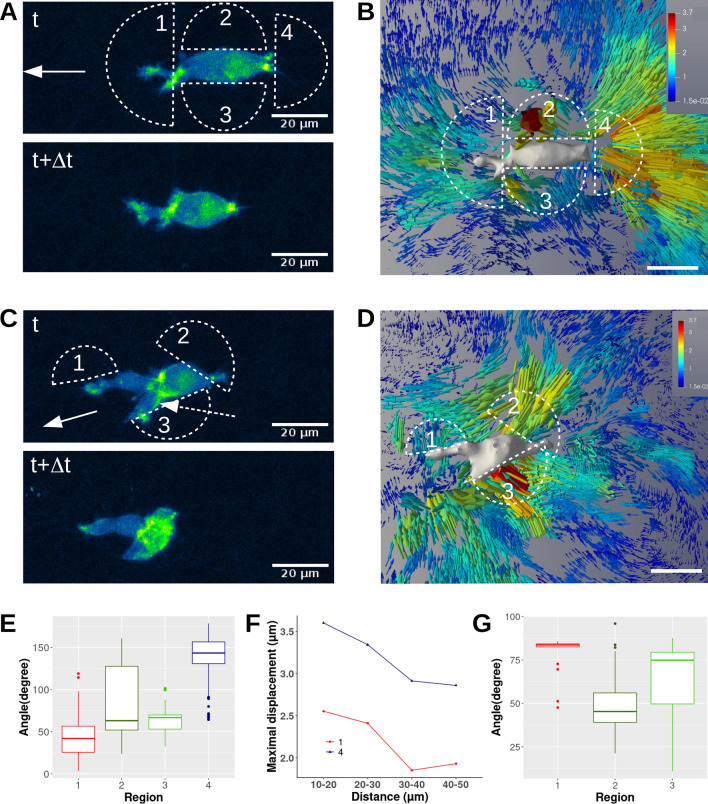
Figure 4.
T24 cell migrating in 0.95 mg/mL collagen. (A) and (C) Two successive images of F-actin (projected Z-stack fluorescence). White half-circles indicate regions of interest. The white arrow indicates the direction of migration whereas the white dotted arrow indicates actin-rich regions inside the nucleus. (B) and (D) show the collagen fiber 3D-displacement field around the migrating cell. For more visibility, the initial 3D cell shape is shown in grey levels and the displacement field is shown for a half space. Vector lengths and colors indicate the displacement magnitude in μm. Scale bar = 20 μm. (E) and (G) Box and whisker plots of fiber displacement vector angles versus cell migration direction for regions of interest. (F) Maximum displacement amplitudes as a function of cell-fiber distance for the actin-rich regions 1 and 4 in (A).

