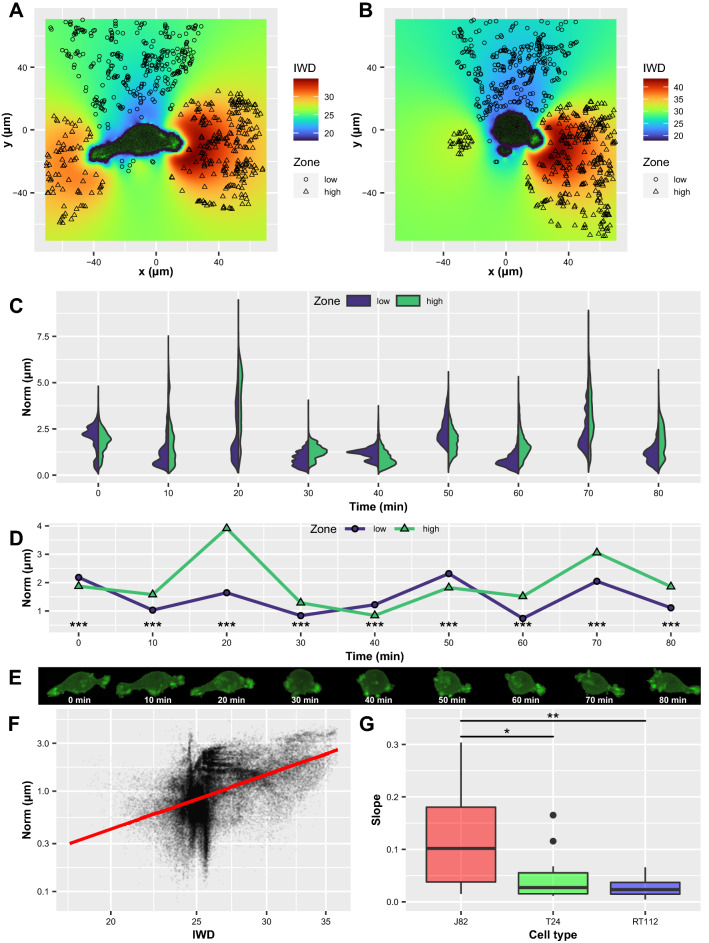
Figure 5.
Correlation between actin intensities and displacement magnitudes (J82 cell). (A,B) Values of IWDs are shown at two different times, 20 min, and 30 min. Symbols represent low and high IWDs, respectively [0–25%] and [75–100%] ranges. (C) Violin plots of the displacement norm distributions corresponding to low (blue) and high (green) IWD values in time. (D) Median of the norms (low and high IWDs) vs. time, with significant difference from Kruskal-Wallis test. (E) Corresponding cell shapes. (F) Displacement norms vs. weighted actin intensities (IWD) for t = 20 min. The red line is the regression curve. (G) Slopes of regression curves at times for which Norm/Norm> 1, for the three cell types. Significance of Kruskal-Wallis test, followed by Dunn’s test with Bonferroni adjustment.

