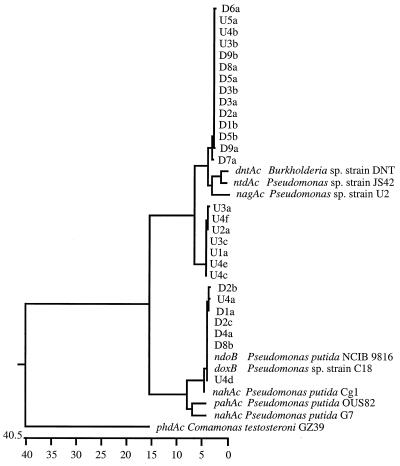
FIG. 5.
Cluster analysis examining the percent dissimilarity of 28 nahAc-like mRNA sequences derived from well water and the corresponding 401-bp sequence from nine bacteria (see the text). The notation for each sequence specifies if the cDNA was diluted (D) or undiluted (U) before PCR amplification and cloning; which PCR (1 to 5 for U and 1 to 9 for D) produced the clone; and the order in which an insert was sequenced from each reaction (e.g., “a” was the first and “e” was the fifth).

