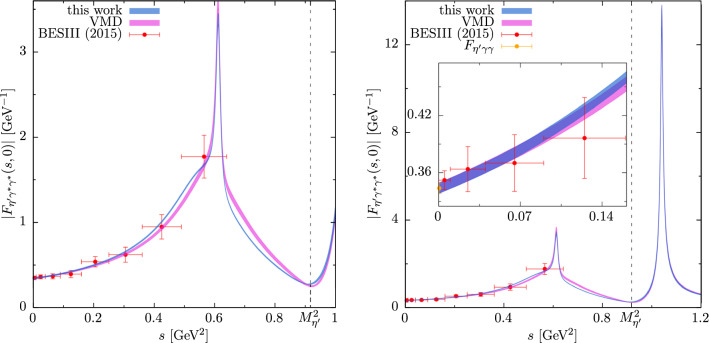
Fig. 2.
Determination of the TFF by means of Eq. (2.3) in comparison to data from BESIII [108] (statistical and systematic errors added in quadrature) scaled with from Table 1 and the VMD model of Eq. (D.23) with resonance contribution according to Eq. (D.22); for the kinematic range accessible in decays (left) and a larger time-like region including the resonance with inset magnifying the low-s region (right). See also Ref. [109] for an earlier version of this figure

