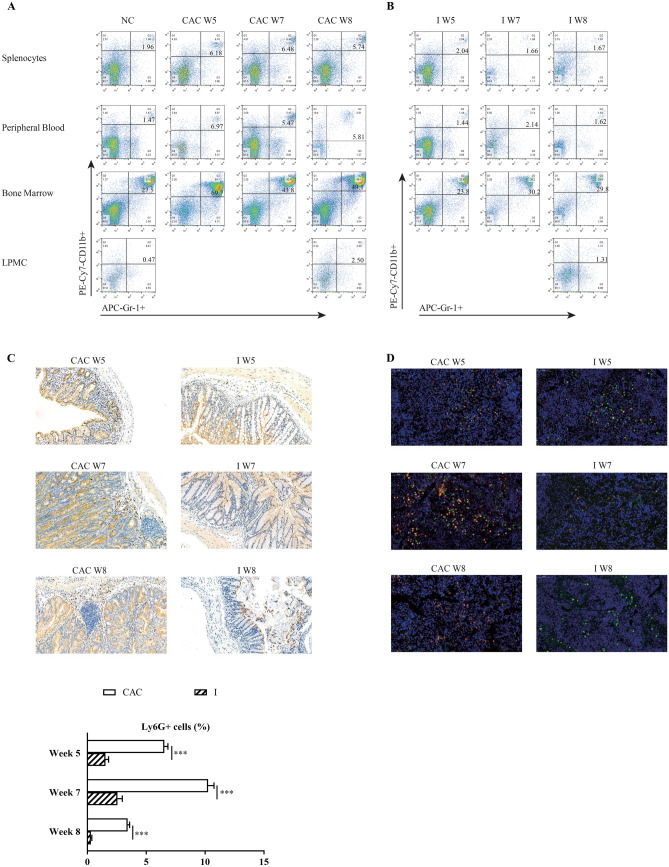
Fig. 1.
(A, B) Population of CD11b+Gr-1+ MDSCs in the spleen, PB, BM, and LP by flow cytometry five, seven and eight weeks post-induction (W5, W7 and W8) in the CAC group and the normal control group (NC, A) and in the MyD88 inhibitor-treated group (I, B). N = 5 per group. C&D) IHC staining for Ly6G+ cells of colon sections (C) and IF staining for CD11b+ (green) Ly6G+ (red) cells of spleen sections (D) in the CAC group and the I group five, seven and eight weeks post-induction (W5, W7 and W8). Scar bar = 50 μM. Histogram at the bottom (C) shows the percentage of positive Ly6G+ cells in total cells. N = 4 per group. Data are expressed as the mean ± SD of each group. ***P < 0.001

