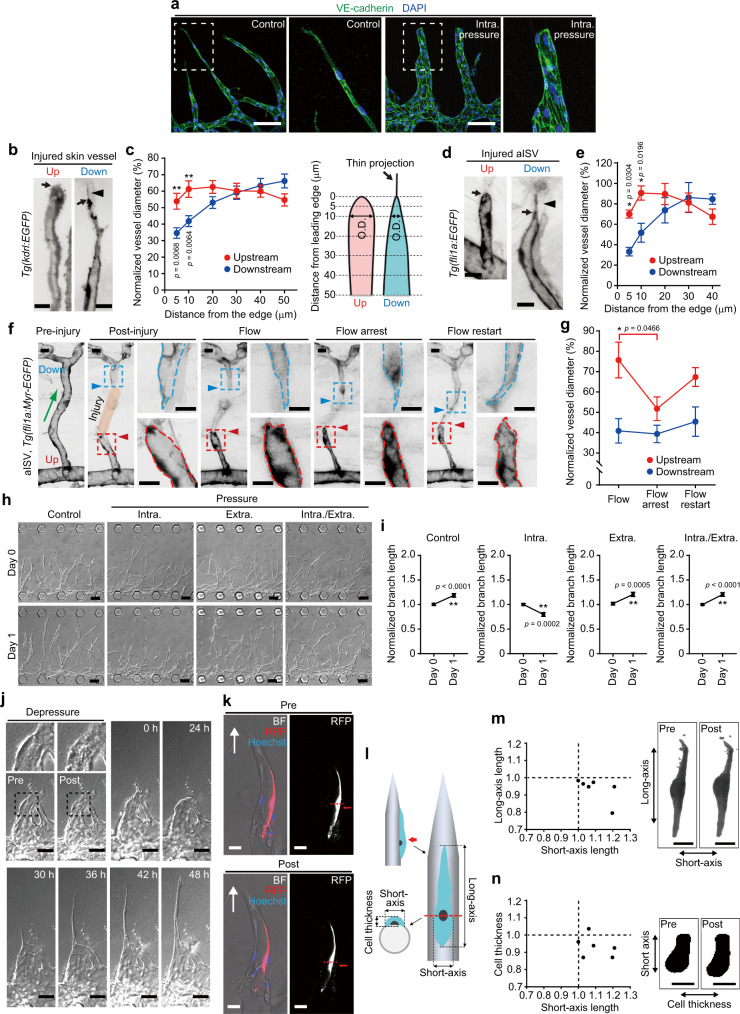
Fig. 3. IP loading inhibits elongation of angiogenic sprouts via stretching of ECs.
a Confocal z-projection images of on-chip angiogenic branches loaded without (left) or with IP (right) for 3 days. Green, VE-cadherin; blue, DAPI. b, d Confocal z-projection images of upstream (Up) and downstream (Down) injured vessels [b skin vessels in adult Tg(kdrl:EGFP) zebrafish; d aISVs in 3 dpf Tg(fli1a:EGFP) larva]. c, e Outer diameters (O.D.) of the upstream (red) and downstream (blue) injured vessels as in b, d are shown as percentages relative to that of pre-injured vessels. The x-axis shows the distance from the leading edge (arrows in b, d). Thin projections (arrowheads in b, d) are excluded from measurement. Data are means ± s.e.m. [c, upstream and downstream, n = 23 and 19 vessels examined over 10 and 11 animals, except for upstream at 50 μm (n = 22) and downstream at 30 μm (n = 18); d, upstream and downstream, n = 6 animals for each, except for upstream at 40 μm (n = 4) and downstream at 40 μm (n = 5)]. f Effects of changes in blood flow on the morphology of injured aISVs. Images of pre- (Pre-injury) and post-injured (Post-injury) aISVs in 3 dpf Tg(fli1a:Myr-EGFP) larva and its subsequent images at 3 hpi (Flow), after tricaine-induced blood flow arrest (Flow arrest), and after restarting blood flow (Flow restart). g Outer diameters of injured aISVs at 10 µm from the leading edge are as in c [upstream and downstream at Flow (n = 9 and 10 animals), Flow arrest (n = 9 and 10 animals), Flow restart (n = 8 and 9 animals)]. h DIC images of on-chip angiogenic branches before and 1 day after loading without (Control) and with IP (Intra.), EP (Extra.), or both types of pressure (Intra./Extra.). i Quantification of branch lengths as in h. Normalized values relative to that before pressure loading are means ± s.e.m. (the number of branches examined over 4 independent experiments: Control, n = 68 and 67; IP, n = 40 and 38; EP, n = 50 and 50; IP/EP, n = 50 and 50, for Days 0 and 1). j DIC images of IP-loaded angiogenic branch (Pre) and, subsequently, an unloaded vessel (Post) and its subsequent time-lapse images at elapsed times indicated at top. k Confocal z-projection images merged with bright-field images of an angiogenic branch, with a small population of RFP-expressing ECs, before (Pre) and after (Post) IP loading. Arrows, elongation direction; red, RFP; blue, Hoechst 33342. Right, binary RFP images. l–n Changes in Short- and Long-axis lengths of cells (m) and those in Short-axis length and Cell thickness of cells (n) upon IP loading were measured as in l, and expressed as a ratio of the values before and after IP loading. Each dot represents an individual cell. Right, binary images of RFP-expressing cells. Boxed areas are enlarged on the right (a, f) and top (j). Statistical significance was determined by two-way ANOVA followed by Sidak’s test (c, e), Kruskal–Wallis followed by Dunn’s test among the changes in the upstream or downstream vessel (g), and two-sided t test (i). *p < 0.05, **p < 0.01. Source data are provided as a Source data file. Scale bars: 100 µm (a, h), 10 µm (b, d, f), 50 µm (j), 25 µm (k, m, n).

