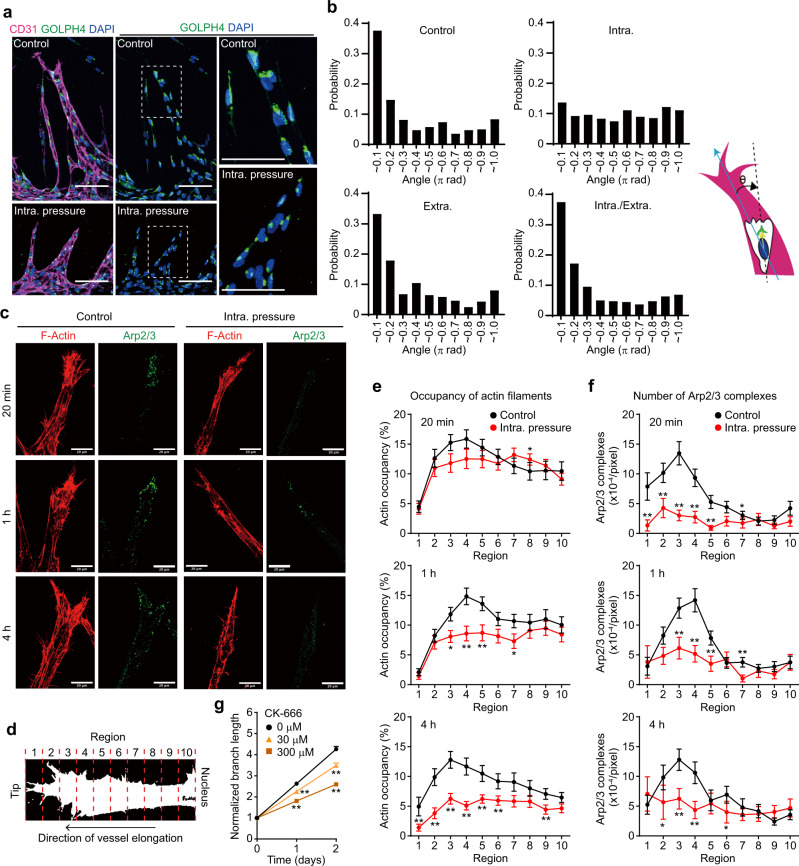
Fig. 4. IP load-induced stretching of ECs impairs front–rear polarization and Arp2/3 complex-mediated actin polymerization during on-chip angiogenesis.
a, b Effect of pressure loading on EC front–rear polarity in angiogenic branches of on-chip angiogenesis. a Confocal z-projection images of angiogenic branches without (Control) and with (Intra. pressure) IP loading for 24 h. Left, merged images of CD31 (magenta), GOLPH4 (green), and DAPI (blue); right, merged images of GOLPH4 and DAPI. Boxed areas are enlarged on the right. b Histograms showing probability distributions of angles between the vessel elongation direction (blue arrow) and nucleus-Golgi vector (yellow arrow line) in ECs of angiogenic branches in response to indicated pressure load for 24 h (the number of ECs examined over 3 independent experiments: Control, n = 503; Intra., n = 469; Extra., n = 325; Intra./Extra., n = 379). c–f Spatiotemporal changes in distribution patterns of F-actin and Arp2/3 complexes at leading edges of angiogenic branches upon IP loading. c Confocal z-projection images of angiogenic branches without (Control) and with (Intra. pressure) IP loading for indicated periods. Left, F-actin; right, ARPC2 (Arp2/3). d–f The angiogenic branch between the leading edge and the nucleus was divided into 10 regions, as in d. Quantification of occupancy of F-actin (e) and the number of Arp2/3 complexes (f) in individual regions of angiogenic branches without (black) and with (red) IP loading, as in c. Data are means ± s.e.m. (the number of branches examined over 3 independent experiments: 20 min, n = 27 and 27; 1 h, n = 36 and 25; 4 h, n = 30 and 28, for Control and IP, respectively). *p < 0.05, **p < 0.01 versus Control by two-sided Mann–Whitney U test. g Elongation of angiogenic branches of on-chip angiogenesis in the absence (circle) and presence of 30 μM (triangle) and 300 μM (square) CK-666, an Arp2/3 complex inhibitor, was analyzed as in Fig. 2f. Data are means ± s.e.m. (the number of branches examined over 3 independent experiments: 0 μM, n = 60; 30 μM, n = 60; 300 μM, n = 75). **p < 0.01 versus 0 μM by two-way ANOVA followed by Tukey’s test. For detailed statistics in e–g, see Supplementary Table 4. Source data are provided as a Source data file. Scale bars: 100 μm (a), 20 μm (c).

