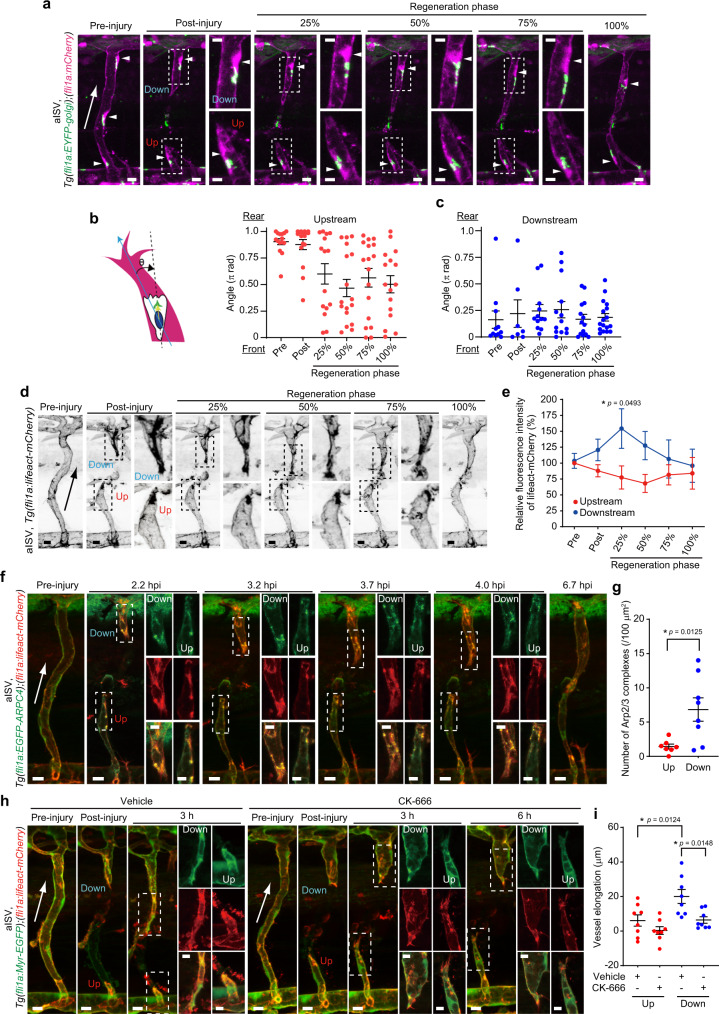
Fig. 5. Upstream injured vessels fail to elongate due to loss of front–rear polarity and impaired Arp2/3 complex-mediated actin polymerization in the ECs.
a Confocal z-projection images of pre- and post-injured aISVs in 3 dpf Tg(fli1a:EYFP-Golgi);(fli1a:mCherry) larva and its subsequent time-lapse images at indicated stages of repair. Images of EYFP-Golgi (green) and mCherry (magenta) are merged. Arrowheads, nuclei. Boxed areas are enlarged on the right. b, c Quantification of front–rear EC polarity in upstream (b) and downstream (c) injured aISVs. Front-rear polarity was analyzed by measuring the angles between the vessel elongation direction and the nucleus-Golgi vector in ECs. Each dot represents an individual cell. Error bars indicate mean ± s.e.m. [the number of ECs over 12 animals: upstream and downstream at pre (n = 15 and 11), post (n = 16 and 7), 25% (n = 15 and 12), 50% (n = 17 and 13), 75% (n = 17 and 14), 100% (n = 16 and 17)]. d Confocal z-projection images of pre- and post-injured aISVs in 3 dpf Tg(fli1a:lifeact-mCherry) larva and its subsequent time-lapse images are shown as in a. e Quantification of F-actin in upstream (red) and downstream (blue) injured aISVs. Relative fluorescence intensity of Lifeact-mCherry in vascular regions within 20 µm from the leading edge is expressed as a percentage of that in pre-injured vessels. Data are means ± s.e.m. [the number of animals: upstream and downstream at pre, post and 50% (n = 5), at 25 and 75% (n = 4), at 100% (n = 3)]. f Confocal z-projection images of pre-injured aISV (left) and injured aISVs at the elapsed time following the injury (hpi) in 3 dpf Tg(fli1a:EGFP-ARPC4);(fli1a:lifeact-mCherry) larva are shown as in a. Images of EGFP-ARPC4 (green) and Lifeact-mCherry (red) are merged. EGFP (top), mCherry (middle), and their merged (bottom) images corresponding to boxed areas are enlarged on the right. g Number of EGFP-ARPC4-labeled Arp2/3 complexes colocalizing with Lifeact-mCherry-marked F-actin in vascular regions within 20 µm from the leading edge at the 25% reparative phase. Each dot represents an individual injured vessel (red and blue, upstream and downstream injured vessels, respectively). Data are means ± s.e.m. (Up and Down, n = 7 and 8 animals). h Confocal z-projection images of pre- and post-injured aISVs and those 3 and 6 h after the beginning of treatment with vehicle or CK-666 in 3 dpf Tg(fli1a:lifeact-mCherry);(fli1a:Myr-EGFP) larva are shown in f. i Amounts of elongation of upstream (red) and downstream (blue) injured aISVs 3 h after the beginning of treatment with vehicle or 200 μM CK-666. Each dot represents an individual injured vessel (red and blue, upstream and downstream injured vessels, respectively). Data are means ± s.e.m. (Up and Down, n = 8 animals). Statistical significance was determined by two-way ANOVA followed by Sidak’s test (e), Welch’s two-sided t test (g), and one-way ANOVA followed by Tukey’s test (i). *p < 0.05. Arrows indicate blood flow direction (a, d, f, h). Source data are provided as a Source data file. Scale bars: 10 µm (a, d, f, h), 5 µm (enlarged images in a, f, h).

