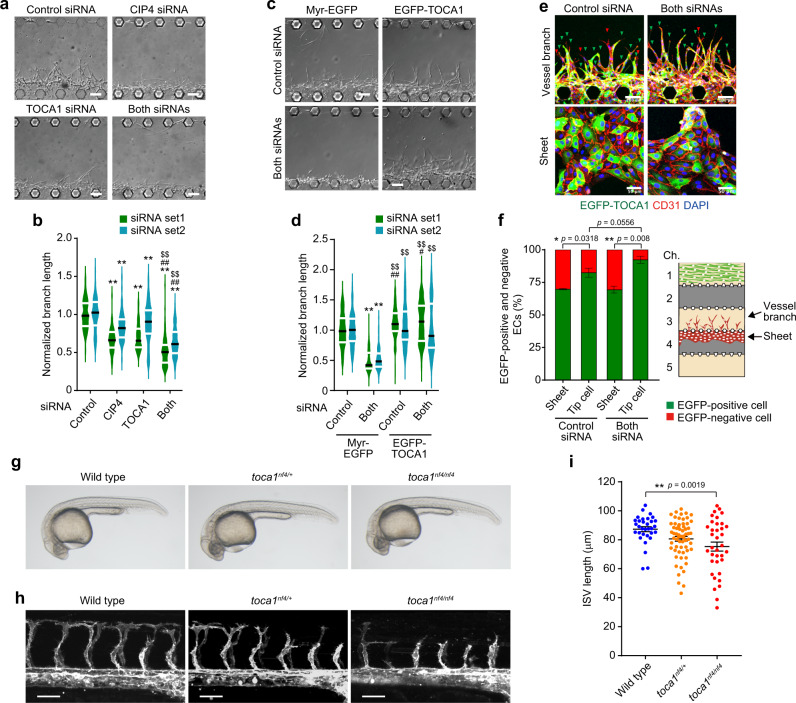
Fig. 6. TOCA family of F-BAR proteins regulate vessel elongation during angiogenesis.
a, b Effects of silencing of CIP4 and TOCA1 on branch elongation in on-chip angiogenesis. a DIC images of angiogenic branches constituted by ECs transfected with the control siRNA, CIP4 siRNA, TOCA1 siRNA, or both siRNA (siRNA set1) after 3 days of culture. b Violin plots of branch lengths as in a (green). Lengths of branches constituted by ECs transfected with another set of siRNAs (siRNA set2) are also shown (blue). Black and white lines indicate the median and quartiles, respectively (each group, n = 75 branches examined over 3 independent experiments). **p < 0.01 versus Control, ##p < 0.01 versus CIP4, $$p < 0.01 versus TOCA1 by two-way ANOVA followed by Tukey’s test. For detailed statistics, see Supplementary Table 4. c, d Rescue of impaired elongation of angiogenic branches constituted by CIP4 and TOCA1-double knockdown ECs by exogenous expression of EGFP-TOCA1. c DIC images of angiogenic branches constituted by siRNA set1-transfected ECs infected with lentiviruses encoding either Myr-EGFP or EGFP-TOCA1 after 3 days of culture. d Violin plots of branch lengths as in c (green). Lengths of angiogenic branches constituted by siRNA set2-transfected ECs are also shown (blue). Black and white lines indicate the median and quartiles, respectively (each group, n = 120 branches examined over 4 independent experiments). **p < 0.01 versus Myr-EGFP/Cont.; ##p < 0.01 versus Myr-EGFP/Cont.; $$p < 0.01 versus Myr-EGFP/Both by the Steel–Dwass test. For detailed statistics, see Supplementary Table 4. e, f Positions of EGFP-TOCA1-transduced ECs in on-chip angiogenic branches. e Confocal z-projection images of angiogenic branches constituted by ECs transfected with control siRNA (Control siRNA) or siRNA set1 (Both siRNAs) and infected with lentivirus encoding EGFP-TOCA1 in channel 3 of the microfluidic device (upper panel) and those of sheet-forming ECs in channel 4 (lower panel). Green, EGFP-TOCA1; red, CD31; blue, DAPI. Green and red arrowheads indicate EGFP-positive and negative tip ECs, respectively. f Percentages of EGFP-positive (green) and negative (red) cells localized at a tip position in angiogenic branches (Tip cell) and percentages of EGFP-positive (green) and negative (red) cells in ECs forming the sheet (Sheet), as in e. Data are means ± s.e.m. (each 5 independent experimental samples). *p < 0.05, **p < 0.01 by two-sided Mann–Whitney U test. g Representative bright-field images of wild-type (left), toca1nf4/+ (middle), and toca1nf4/nf4 (right) zebrafish embryos at 28 hpf. h Confocal z-projection images of trunk vasculature in 28 hpf Tg(fli1a:lifeact-mCherry) embryos with the indicated genotypes. Lateral views with anterior to the left. i Quantification of ISV length, as in h. Each dot represents an individual embryo. Data are means ± s.e.m. (wild type, n = 32; toca1nf4/+, n = 63; toca1nf4/nf4, n = 36). **p < 0.01 by one-way ANOVA followed by Tukey’s test. Source data are provided as a Source data file. Scale bars: 100 µm (a, c, e), 50 µm (h).

