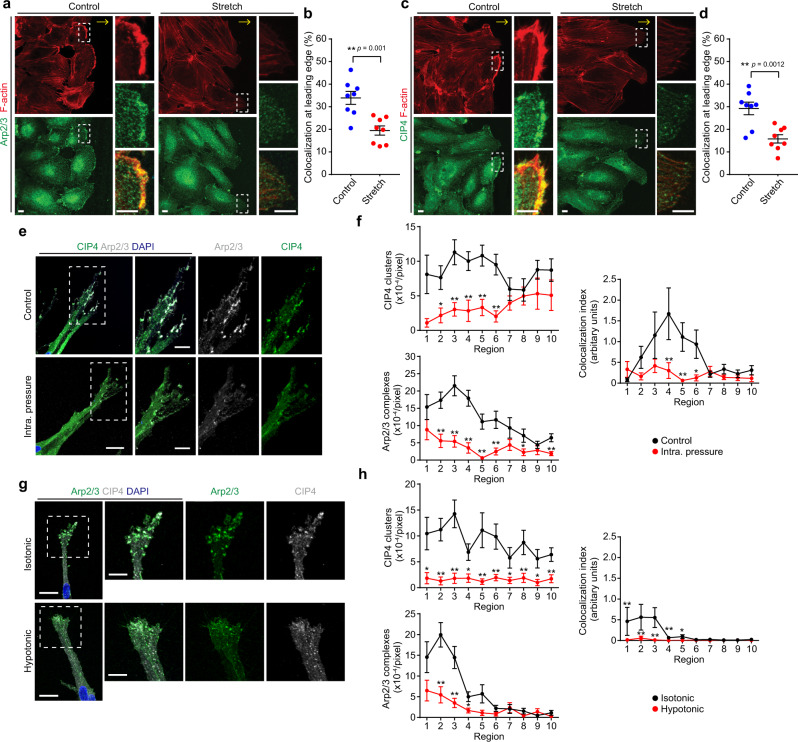
Fig. 8. IP load-induced EC stretching causes detachment of CIP4 and TOCA1 from the leading edge of ECs to inhibit branch elongation.
a–d Effects of biaxial stretching on colocalization of Arp2/3 complexes (a, b) and CIP4 (c, d) with F-actin at leading edges of HUVECs directionally migrating on stretching chambers. Confocal fluorescence images of HUVECs exposed to continuous biaxial stretch for 3 min after being stretched to 10% over 8 min (Stretch) or kept under static conditions (Control). Left upper, F-actin (red); left lower, ARPC2 (Arp2/3, green) (a) or CIP4 (green) (c). F-actin (upper), ARPC2 or CIP4 (middle), and merged (lower) images of boxed areas are enlarged on the right. In a, c, yellow arrows indicate the direction of cell migration. b, d Quantification of Arp2/3 complexes (b) and CIP4 (d) colocalized with F-actin at leading edges of HUVECs, as in a, c, respectively. Each dot represents an individual confocal image (blue, Control; red Stretch). Data are means ± s.e.m (n = 8 regions examined over 2 independent experiments for each). **p < 0.01 by two-sided t test. e, f Effects of IP loading on localization of CIP4 and Arp2/3 complexes at the leading edge of on-chip angiogenic branch. e Confocal z-projection images of angiogenic sprouts loaded without (upper) and with IP (lower) for 20 min. Boxed areas are enlarged on the right. Green, CIP4; gray, ARPC2 (Arp2/3); blue, DAPI. f Quantification of the number of CIP4 clusters (upper left), that of Arp2/3 complexes (lower left), and the degree of their colocalization (right) in individual regions of angiogenic branches, as in e. The number of CIP4 clusters and that of Arp2/3 complexes are shown as in Fig. 4d–f. The colocalization index of CIP4 clusters and Arp2/3 complexes is given as described in “Methods.” Data are means ± s.e.m (Control and IP, n = 23 and 19 branches examined over 3 independent experiments). *p < 0.05, **p < 0.01 versus Control. g, h Effects of hypotonic stimulation on localization of CIP4 and Arp2/3 complexes at the leading edge of an on-chip angiogenic branch. g Confocal z-projection images of angiogenic sprouts treated with isotonic medium (upper) and hypotonic medium (lower) for 5 min are as in e. h Quantitative data of g are as in f. Data are means ± s.e.m. (Isotonic and Hypotonic, n = 20 and 22 branches examined over 3 independent experiments). *p < 0.05, **p < 0.01 versus Control. Statistical significance was determined by two-sided Mann–Whitney U test (f, h). For detailed statistics in f, h, see Supplementary Table 4. Source data are provided as a Source data file.

