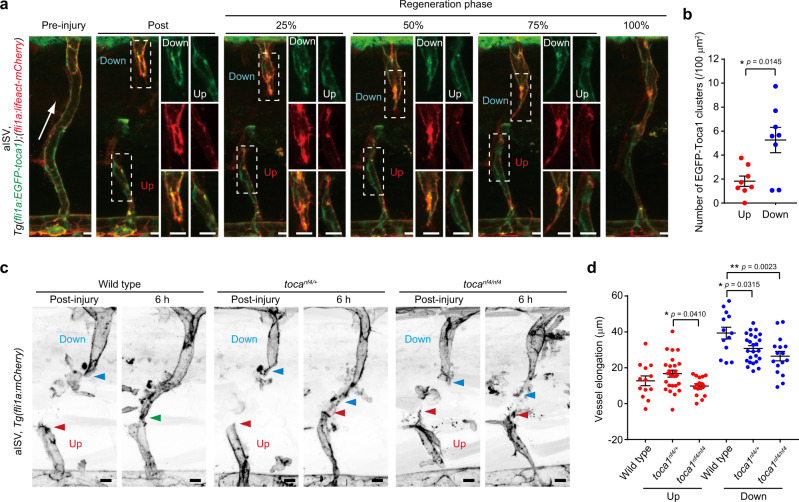
Fig. 9. IP load-induced EC stretching inhibits leading edge localization of Toca1 to suppress elongation of upstream injured vessels.
a, b Localization of EGFP-Toca1 in injured aISVs. a Confocal z-projection images of pre- and post-injured aISVs in the Tg(fli1a:EGFP-toca1);(fli1a:lifeact-mCherry) larva at 3 dpf and its subsequent time-lapse images at the indicated stages of repair. Lateral view, anterior to the left. Images of EGFP-Toca1 (green) and Lifeact-mCherry (red) fluorescence are merged. EGFP (top), mCherry (middle), and their merged (bottom) images corresponding to boxed areas are enlarged on the right. Arrow indicates blood flow direction. b Number of EGFP-Toca1 clusters colocalizing with Lifeact-mCherry-marked F-actin in vascular regions within 20 µm from the leading edge at approximately 25% reparative phase. Each dot represents an individual injured vessel (red and blue, upstream and downstream injured vessels, respectively). Data are means ± s.e.m. (n = 8 animals for each). *p < 0.05 by Welch’s two-sided t test. c, d Elongation of injured aISVs in toca1 mutant zebrafish. c Confocal z-projection images of injured aISVs and those after 6 h in wild-type (left), toca1nf4/+ (middle), and toca1nf4/nf4 (right) larval zebrafish at 3 dpf with Tg(fli1a:lifeact-mCherry) background are as in a. Red and blue arrowheads, leading edges of upstream and downstream injured vessels, respectively; green arrowhead, anastomotic site of the injured vessel. d Quantification of elongation lengths of upstream and downstream injured aISVs in wild type, toca1nf4/+, and toca1nf4/nf4 embryos, as in c. Each dot represents an individual larva (red and blue, upstream and downstream injured vessels, respectively). Data are means ± s.e.m. (wild type, n = 13; toca1nf4/+, n = 25; toca1nf4/nf4, n = 16). *p < 0.05, **p < 0.01 by one-way ANOVA followed by Tukey’s test among the upstream or downstream group. Source data are provided as a Source data file. Scale bars: 10 µm (a, c), 5 µm (enlarged images in a).

