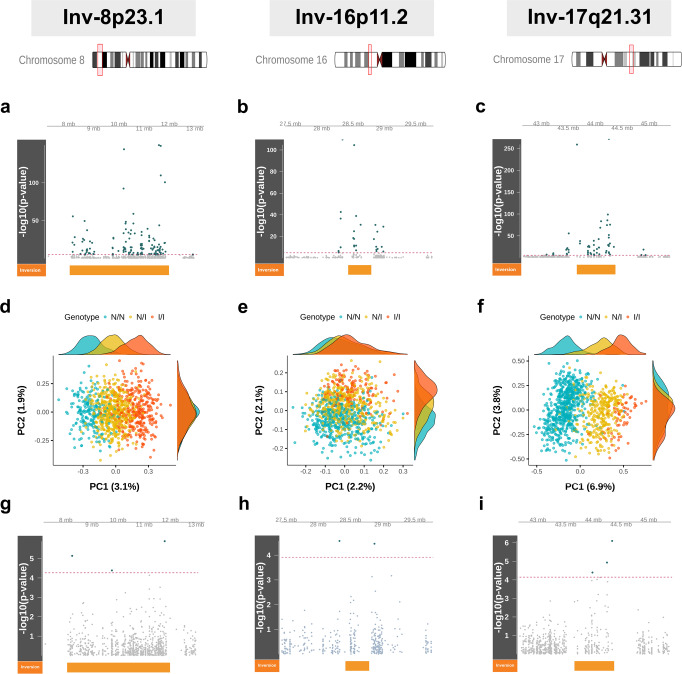
Fig. 1. Inversion status as methylation quantitative trait loci (mQTL) of multiple CpG sites within and surrounding three common human inversions.
The first column in the plot panel corresponds to inv-8p23.1, the second to inv-16p11.2, and the third to inv-17q21.31. a–c Manhattan plots for the significance of the associations between the differential methylation of the CpG sites and the inversion genotypes in child blood cells (N = 1009). The x axes show the chromosome position (±1 Mb between the inversions’ breakpoints). The y axes show the –log10 (P-value). The dashed red line indicates Bonferroni’s threshold of significance. Green points are CpG sites with significant associations and those in gray are nonsignificant. The orange block illustrates the inversions’ region. d–f Principal component (PC) analysis for methylation levels of CpG sites within and surrounding the inversions, revealing remarkably distinctive methylation patterns among the different inversion statuses. Blue points illustrate noninverted homozygous (N/N), yellow illustrates heterozygous (N/I), and orange illustrates inverted homozygous (I/I) individuals. In parenthesis, the methylation variance explained by each PC. g–i Manhattan plots of differentially methylated CpG sites, depending on the inversion genotypes in fetal heart DNA (N = 40).

