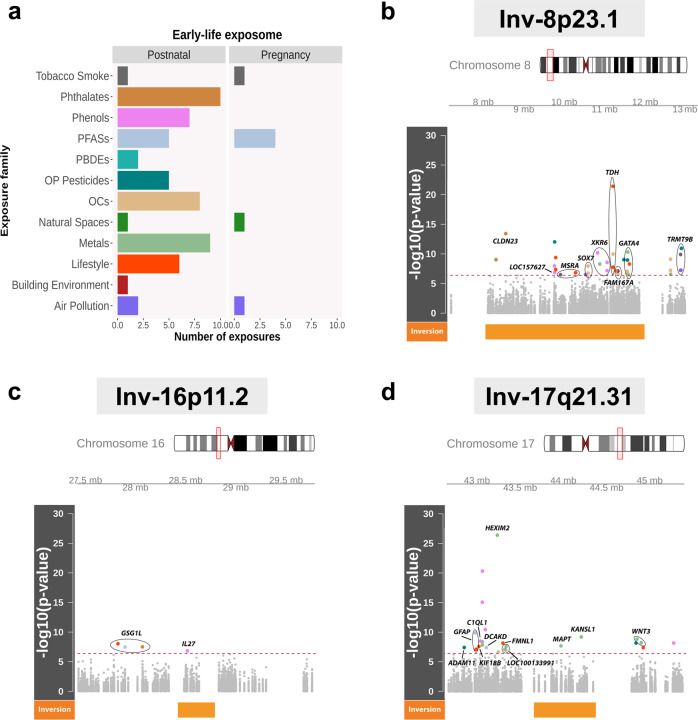
Fig. 2. Inversion-exposure interactions as methylation quantitative trait loci (mQTL) of multiple CpG sites within and surrounding three common human inversions.
a Number of exposures per family in the early-life exposome from the HELIX project. b–d Manhattan plots showing the significance of the associations (N = 1009) between the differential methylation of the CpG sites and the inversion-exposure interactions across all 64 exposures in (a) and the genotypes of three human inversions at 8p.23.1 (b); 16p11.2 (c); and 17q21.31 (d), illustrated by the orange block. The x axes show the chromosome position (±1 Mb between the inversions’ breakpoints). The y axes show the –log10 (P-value) of the associations. The dashed red line indicates Bonferroni’s threshold of significance. Significant results are colored according to the family exposure (a) and labeled according to the closest gene to the CpG (Illumina annotation). Gray points are not significant.

