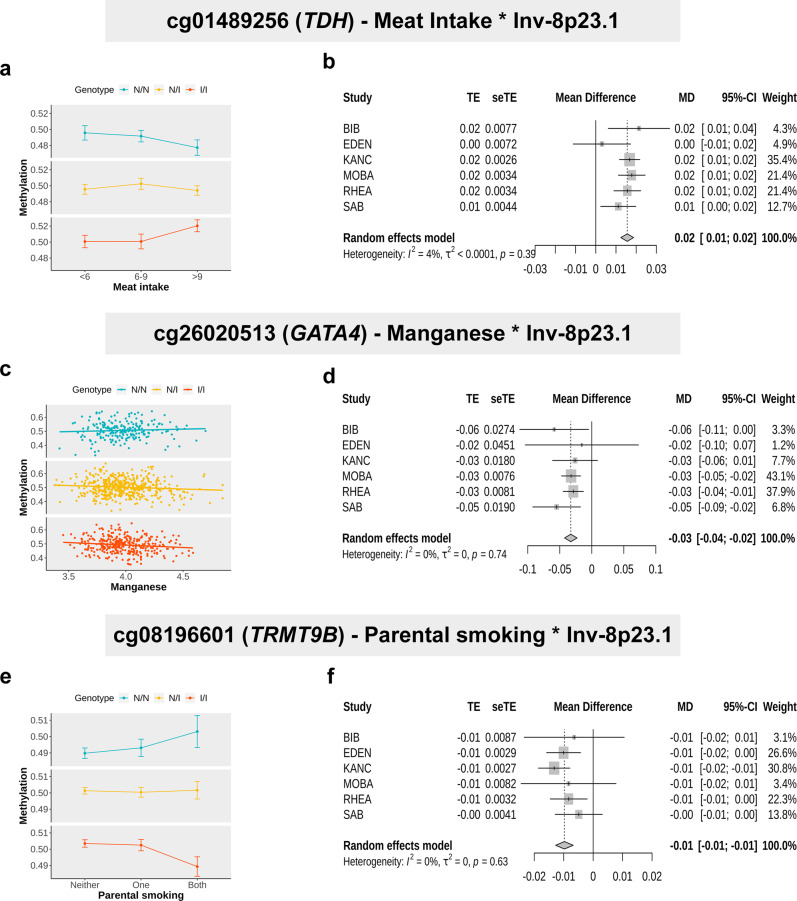
Fig. 3. Interaction and forest plots for TDH, GATA4, and TRMT9B genes.
a Interaction plot illustrating differences across inv-8p23.1 genotypes in the association between cg01489256 (TDH) methylation and meat intake (expressed in servings per week). Methylation means the given meat-intake status and inversion genotype are represented with their 95% confidence intervals (N = 1009). b Forest plot showing the meta-analysis effect estimates of inv-8p23.1–meat-intake interaction on cg01489256 methylation across HELIX cohorts. c Interaction plot illustrating differences across inv-8p23.1 genotypes in the association between cg26020513 (GATA4) methylation and manganese (N = 1009). d Forest plot showing the meta-analysis effect estimates of inv-8p23.1–manganese interaction on cg26020513 methylation across HELIX cohorts. e Interaction plot illustrating differences across inv-8p23.1 genotypes in the association between cg08196601 (TRMT9B) methylation and parental smoking (N = 1009). f Forest plot showing the meta-analysis effect estimates of the inv-8p23.1–parental smoking interaction on cg08196601 methylation across HELIX cohorts. Blue points and lines illustrate noninverted homozygous (N/N), yellow illustrates heterozygous (N/I), and orange illustrates inverted homozygous (I/I) individuals. The error bar represents one standard deviation.

