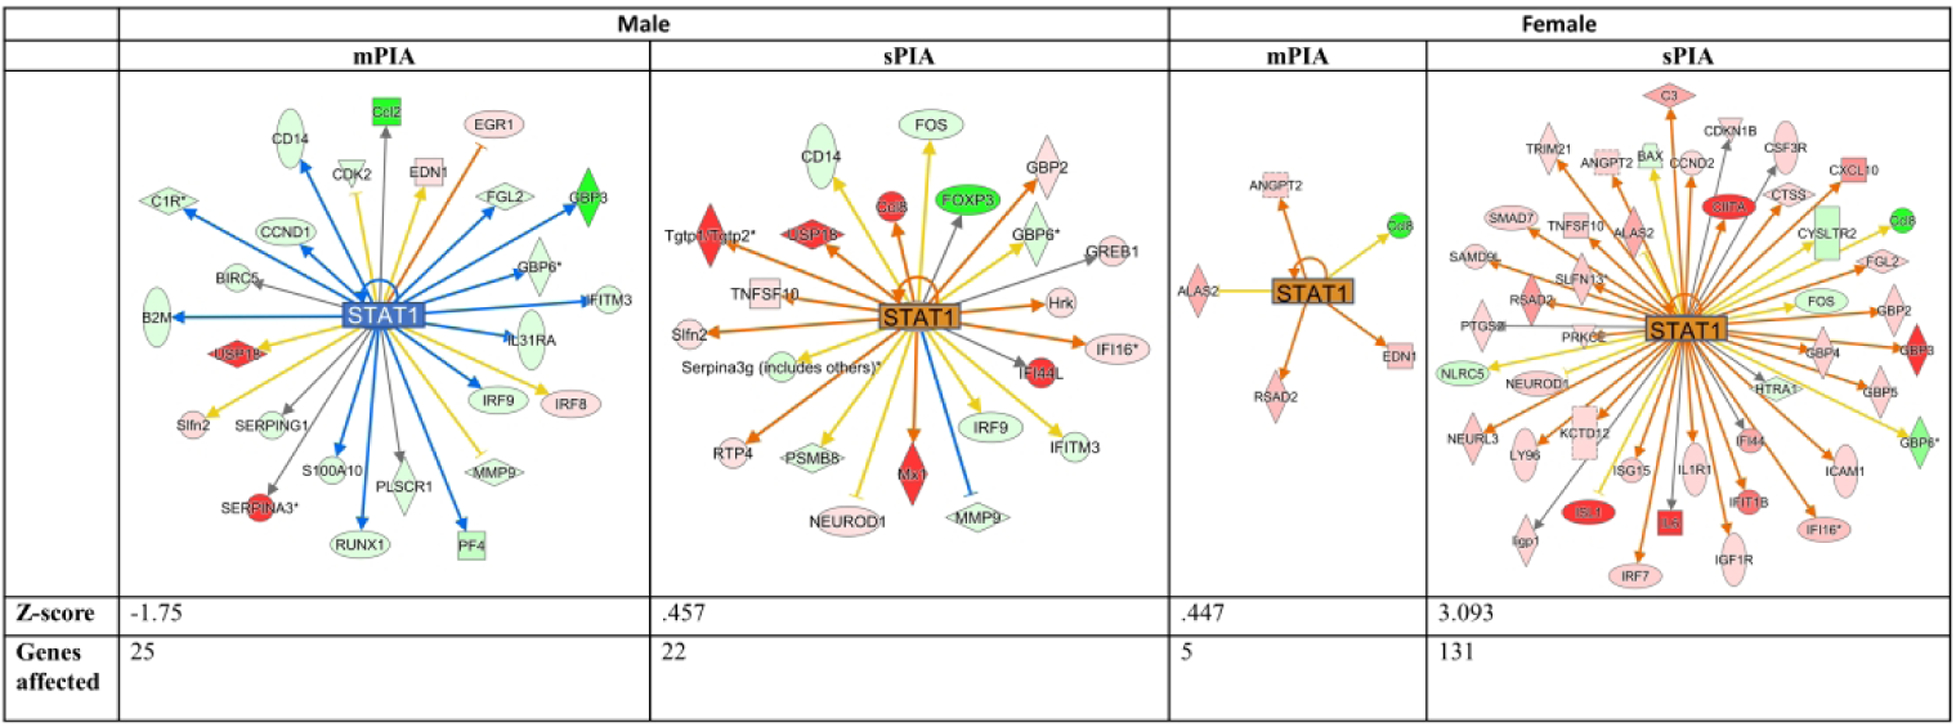
Figure 3: STAT1 dysregulation across PIA severity in males and females.

sPIA females are predicted to have a significant upregulation of the STAT1 pathway. sPIA and mPIA males showed a similar dysregulation but opposite directionality. Red- and green-filled shapes indicate up- and downregulation of genes, respectively, with brighter color indicating larger differences. Orange lines indicate activation; blue lines indicate inhibition; yellow lines indicate findings inconsistent with the state of downstream activity; gray lines indicate that the effect is not predicted.
