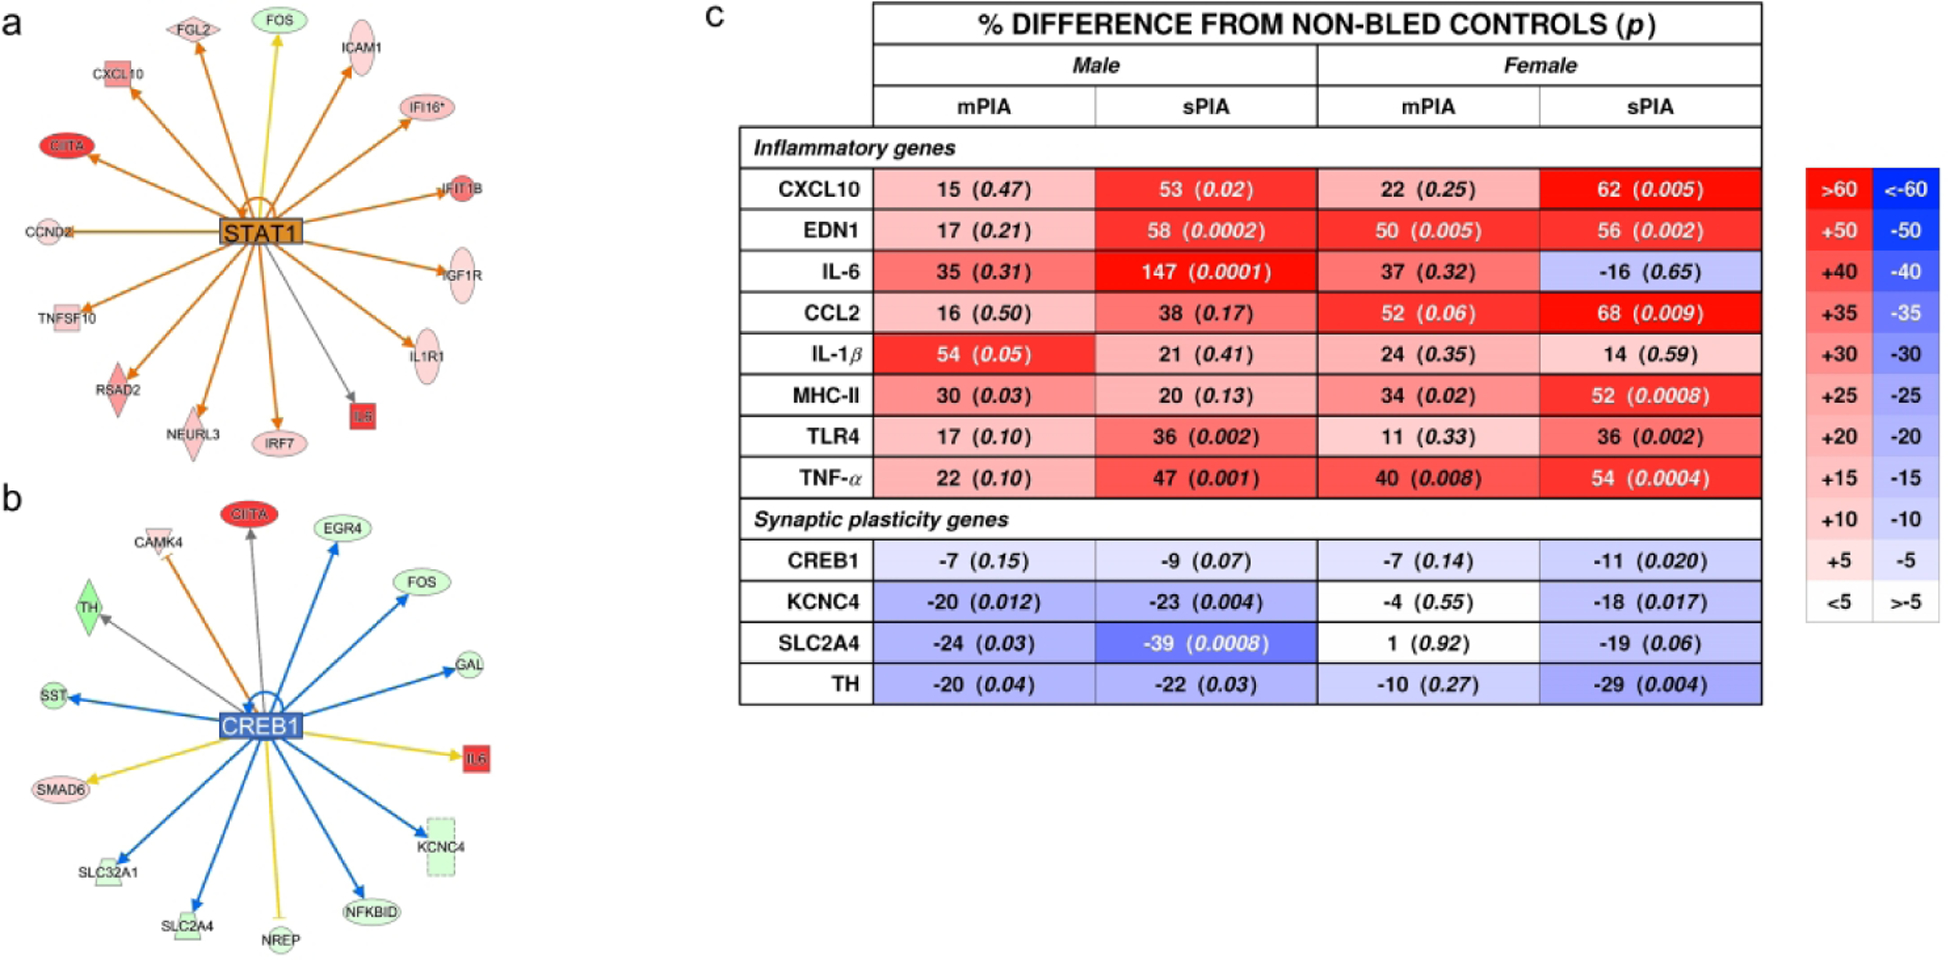
Figure 4: Inflammatory and synaptic plasticity genes affected by PIA.

Selected genes from the (A) STAT1 pathway and (B) CREB1 pathway were selected for confirmatory qPCR analyses along with other common inflammatory genes. Percentage difference from NBCs and p values are summarized in panel (C). Color intensity increases for increased difference. There was increased dysregulation after 25%, indicating a threshold response for males. Females showed a dose-dependent response to hematocrit for most genes at 18%.
