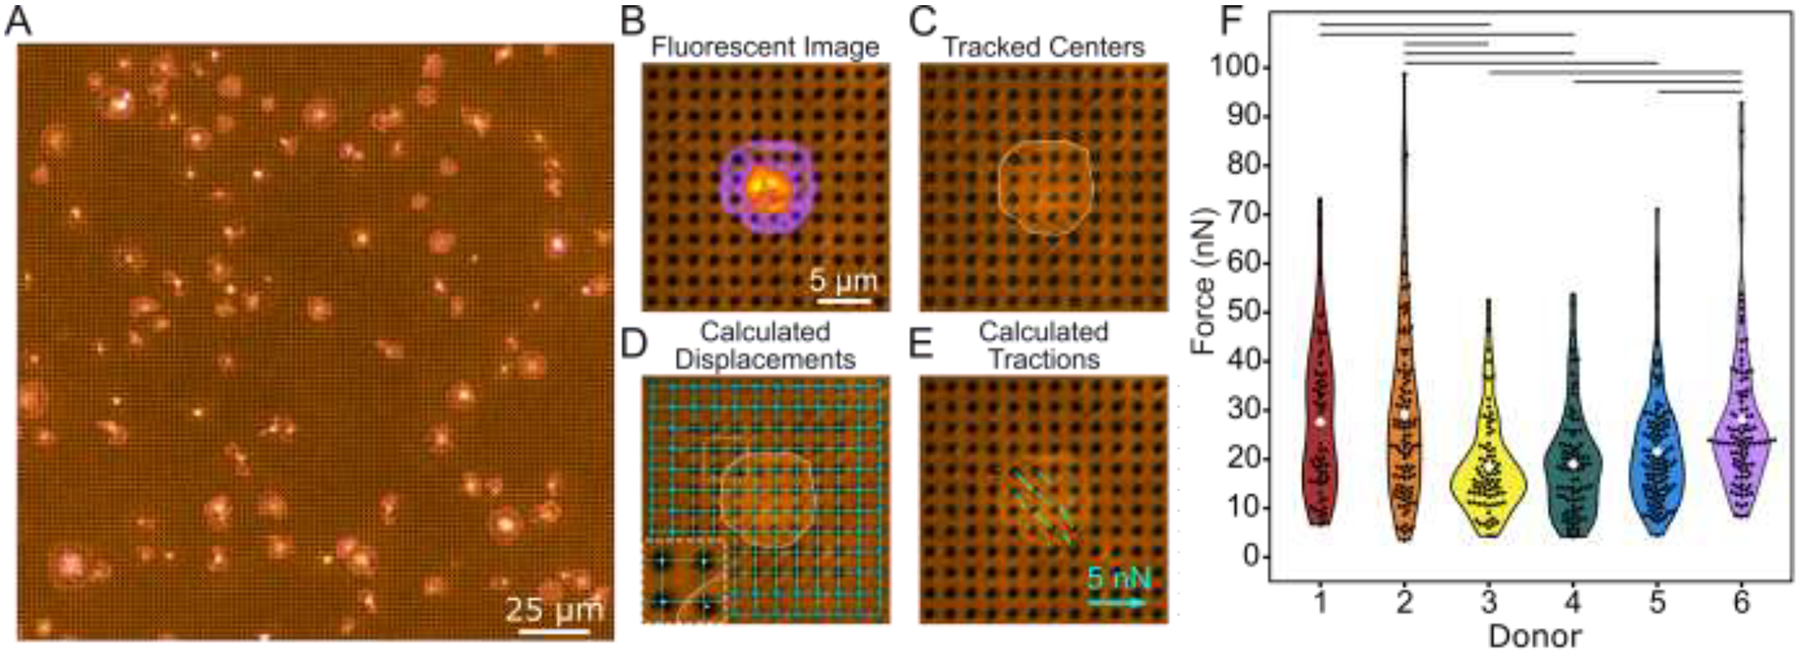
Figure 2 –

Black dots offer a higher yield way to measure forces. (A) Example of a field of view containing many platelets adhered to and contracting on the black dots. Here, platelets are stained for both F-actin (green) and GPIb (magenta). Note that unspread platelets, platelets too close to their neighbor, or platelets too close to the edge are excluded from analysis, as described in the methods cell exclusion criteria section and as shown in Supplementary Fig. 4A. (B) A fluorescence image of deformed substrate with platelet stained for F-actin (pixel intensity scaled from purple to yellow). (C) The black dots pattern is binarized and the centroid of each dot is found using automated detection. (D) Undeformed dots near the edges (circled) are used to fit horizontal and vertical lines throughout the entire field of view. The intersection of these lines marks the zero-displacement state of each dot. Inset is 2x magnified. (E) Forces are calculated from the displacement of each dot relative to its zero-displacement (undeformed) location. (F) Forces from at least 100 platelets from 6 donors show high variability within each donor and between donors. Lines indicate significant differences in donor forces (p < 0.05 when tested with a one-way ANOVA and Tukey’s post hoc test). Number of cells analyzed for donors 1, 2, 3, 4, 5, and 6 are n = 111, 117, 100, 120, 112, and 100, respectively.
