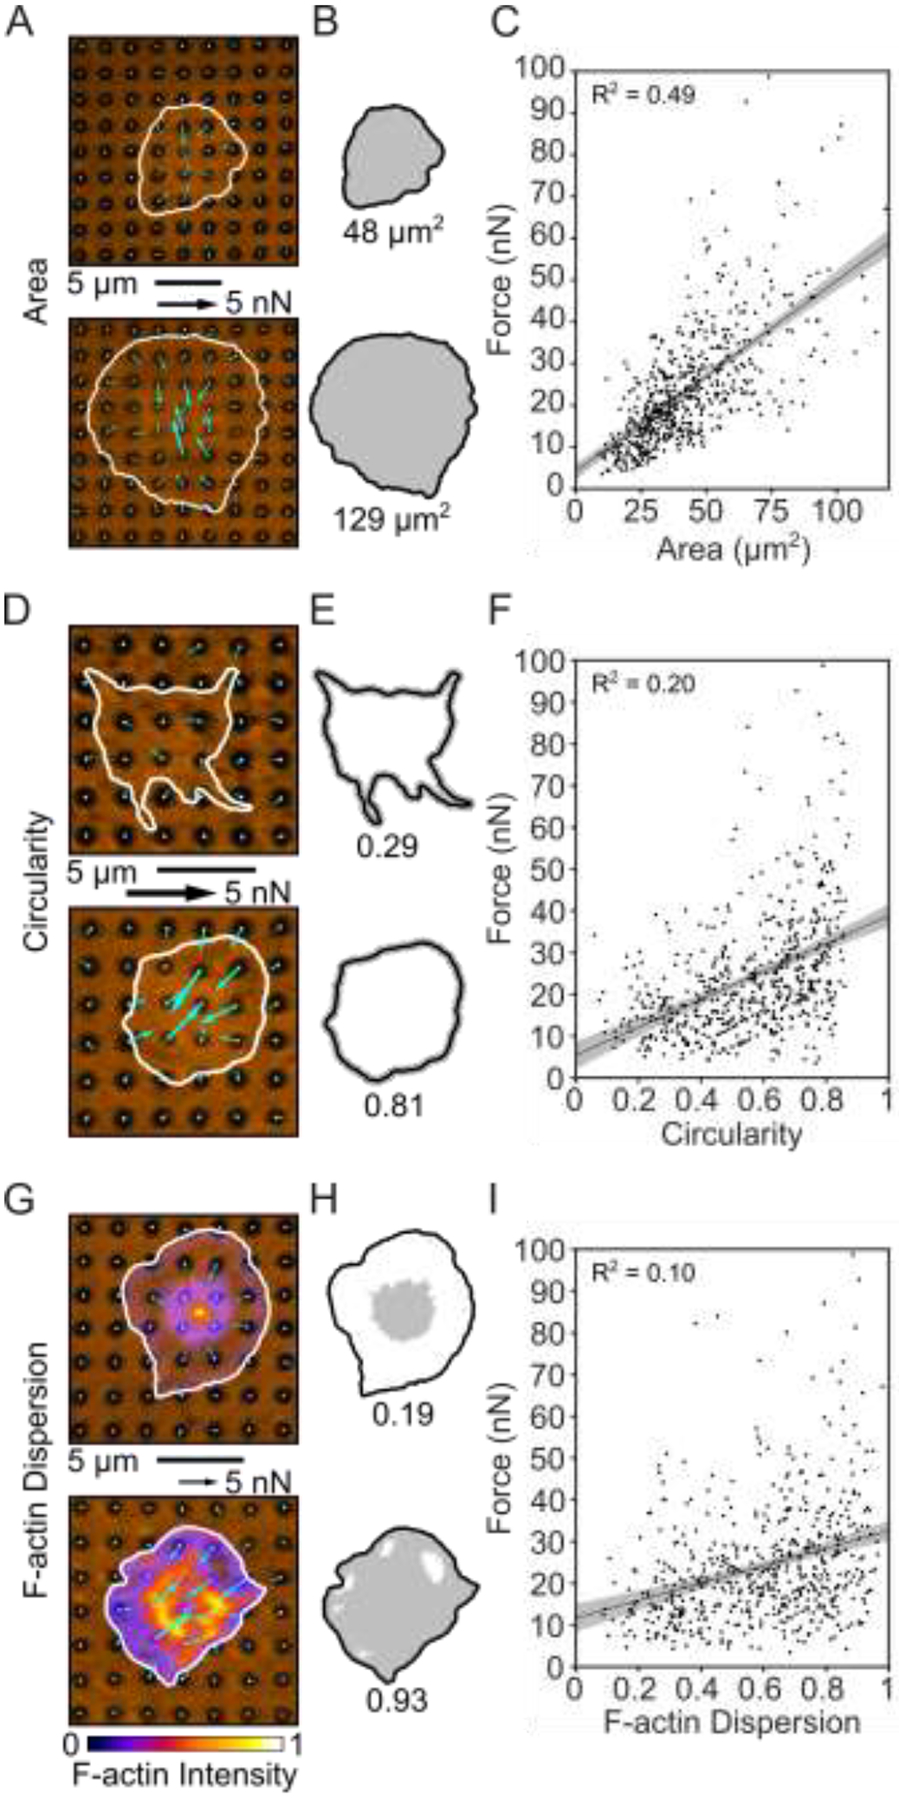
Figure 3 –

Platelet size, shape, and structure correlate with force. (A) Two examples of platelets with small and large areas. (B) Cell boundary and area measured from (A). (C) Platelet forces and area are linearly related. Note that in this panel, the x-axis maximum is zoomed to better view the data. Due to this axis zoom, two points (0.37% of the data) are not shown, but all points are included within all analyses (including the fit line calculation). (D) Two examples of platelets with low and high circularity. (E) Cell boundary and circularity measured from (D). (F) Platelet force and circularity show a moderate positive relationship. (G) Two examples of platelets with low and high F-actin dispersion. Color bar indicates fluorescence intensity which has been normalized to calculate F-actin dispersion. (H) Cell boundary and F-actin dispersion measured from (G). (I) F-actin dispersion is moderately positively correlated with platelet force. Shaded regions of fit lines indicate 95% prediction interval for the data.
