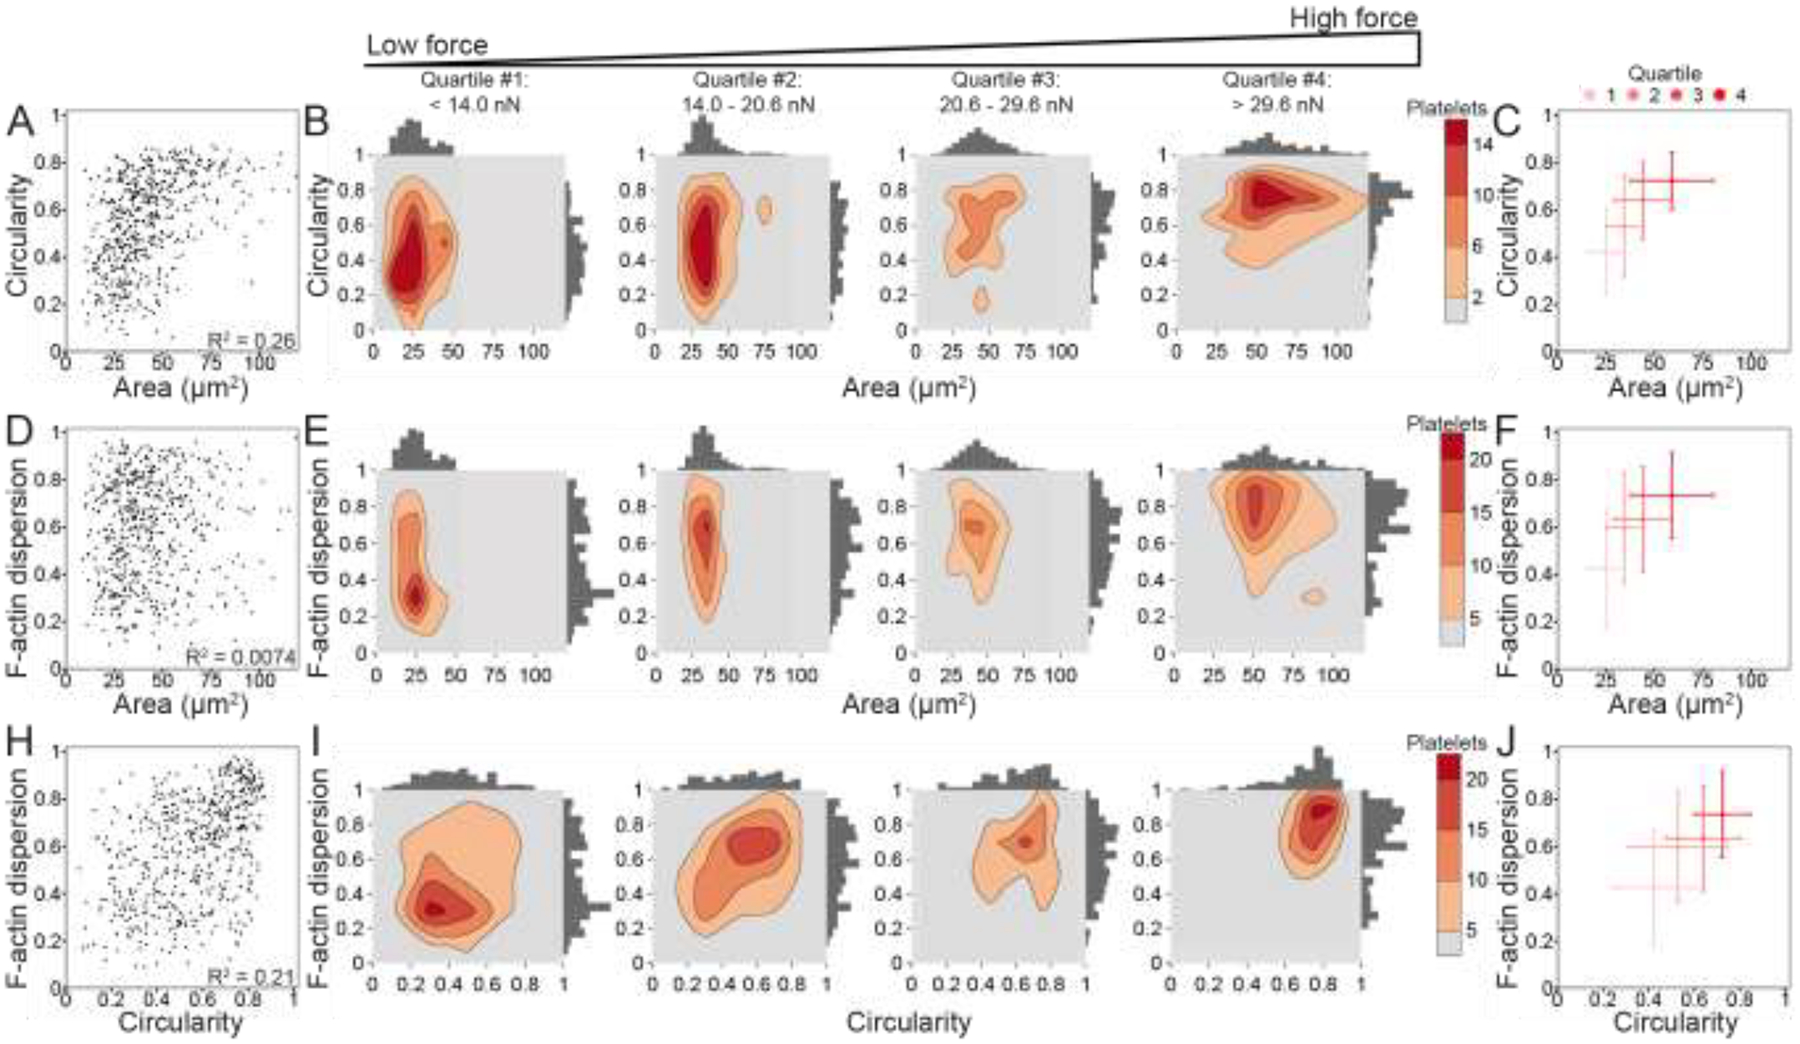
Figure 4 –

Platelet size, shape, and structure do not strongly correlate with each other, but increase together with force. (A) Area and circularity moderately correlate (R2 = 0.26) when plotting platelets of all forces (n = 540). (B) To examine the relationship of circularity and area with increasing force, platelets are split into four quartiles (n = 135 in each quartile) by force, where the lowest force quartile (quartile #1) includes platelets generating less than 14.0 nN force, quartile #2 contains platelets generating 14.0–20.6 nN force, quartile #3 contains platelets generating 20.6–29.6 nN force, and the highest force quartile (quartile #4) contains platelets generating greater than 29.6 nN force. Contour density plots and histograms of area and circularity at each force quartile show that quartile #1 (low-force platelets) have low area and a large range of circularity, while quartile #4 (high-force platelets) tend to have both higher area and high circularity. (C) The median and median standard deviation show that circularity and area increase together with each force quartile. (D) F-actin dispersion and area do not correlate (R2 = 0.0074), (E-F) but show a similar trend when examining force quartiles. (H) F-actin dispersion and circularity moderately correlate (R2 = 0.21) and (I-J) show a shift from low-force platelets having large ranges of circularity and F-actin dispersion to high-force platelets have high circularity and high F-actin dispersion. Note that in A-F, the x-axis maximum is zoomed to better view the data. Due to this axis zoom, two points (0.37% of the data) are not shown, but all points are included within all analyses.
