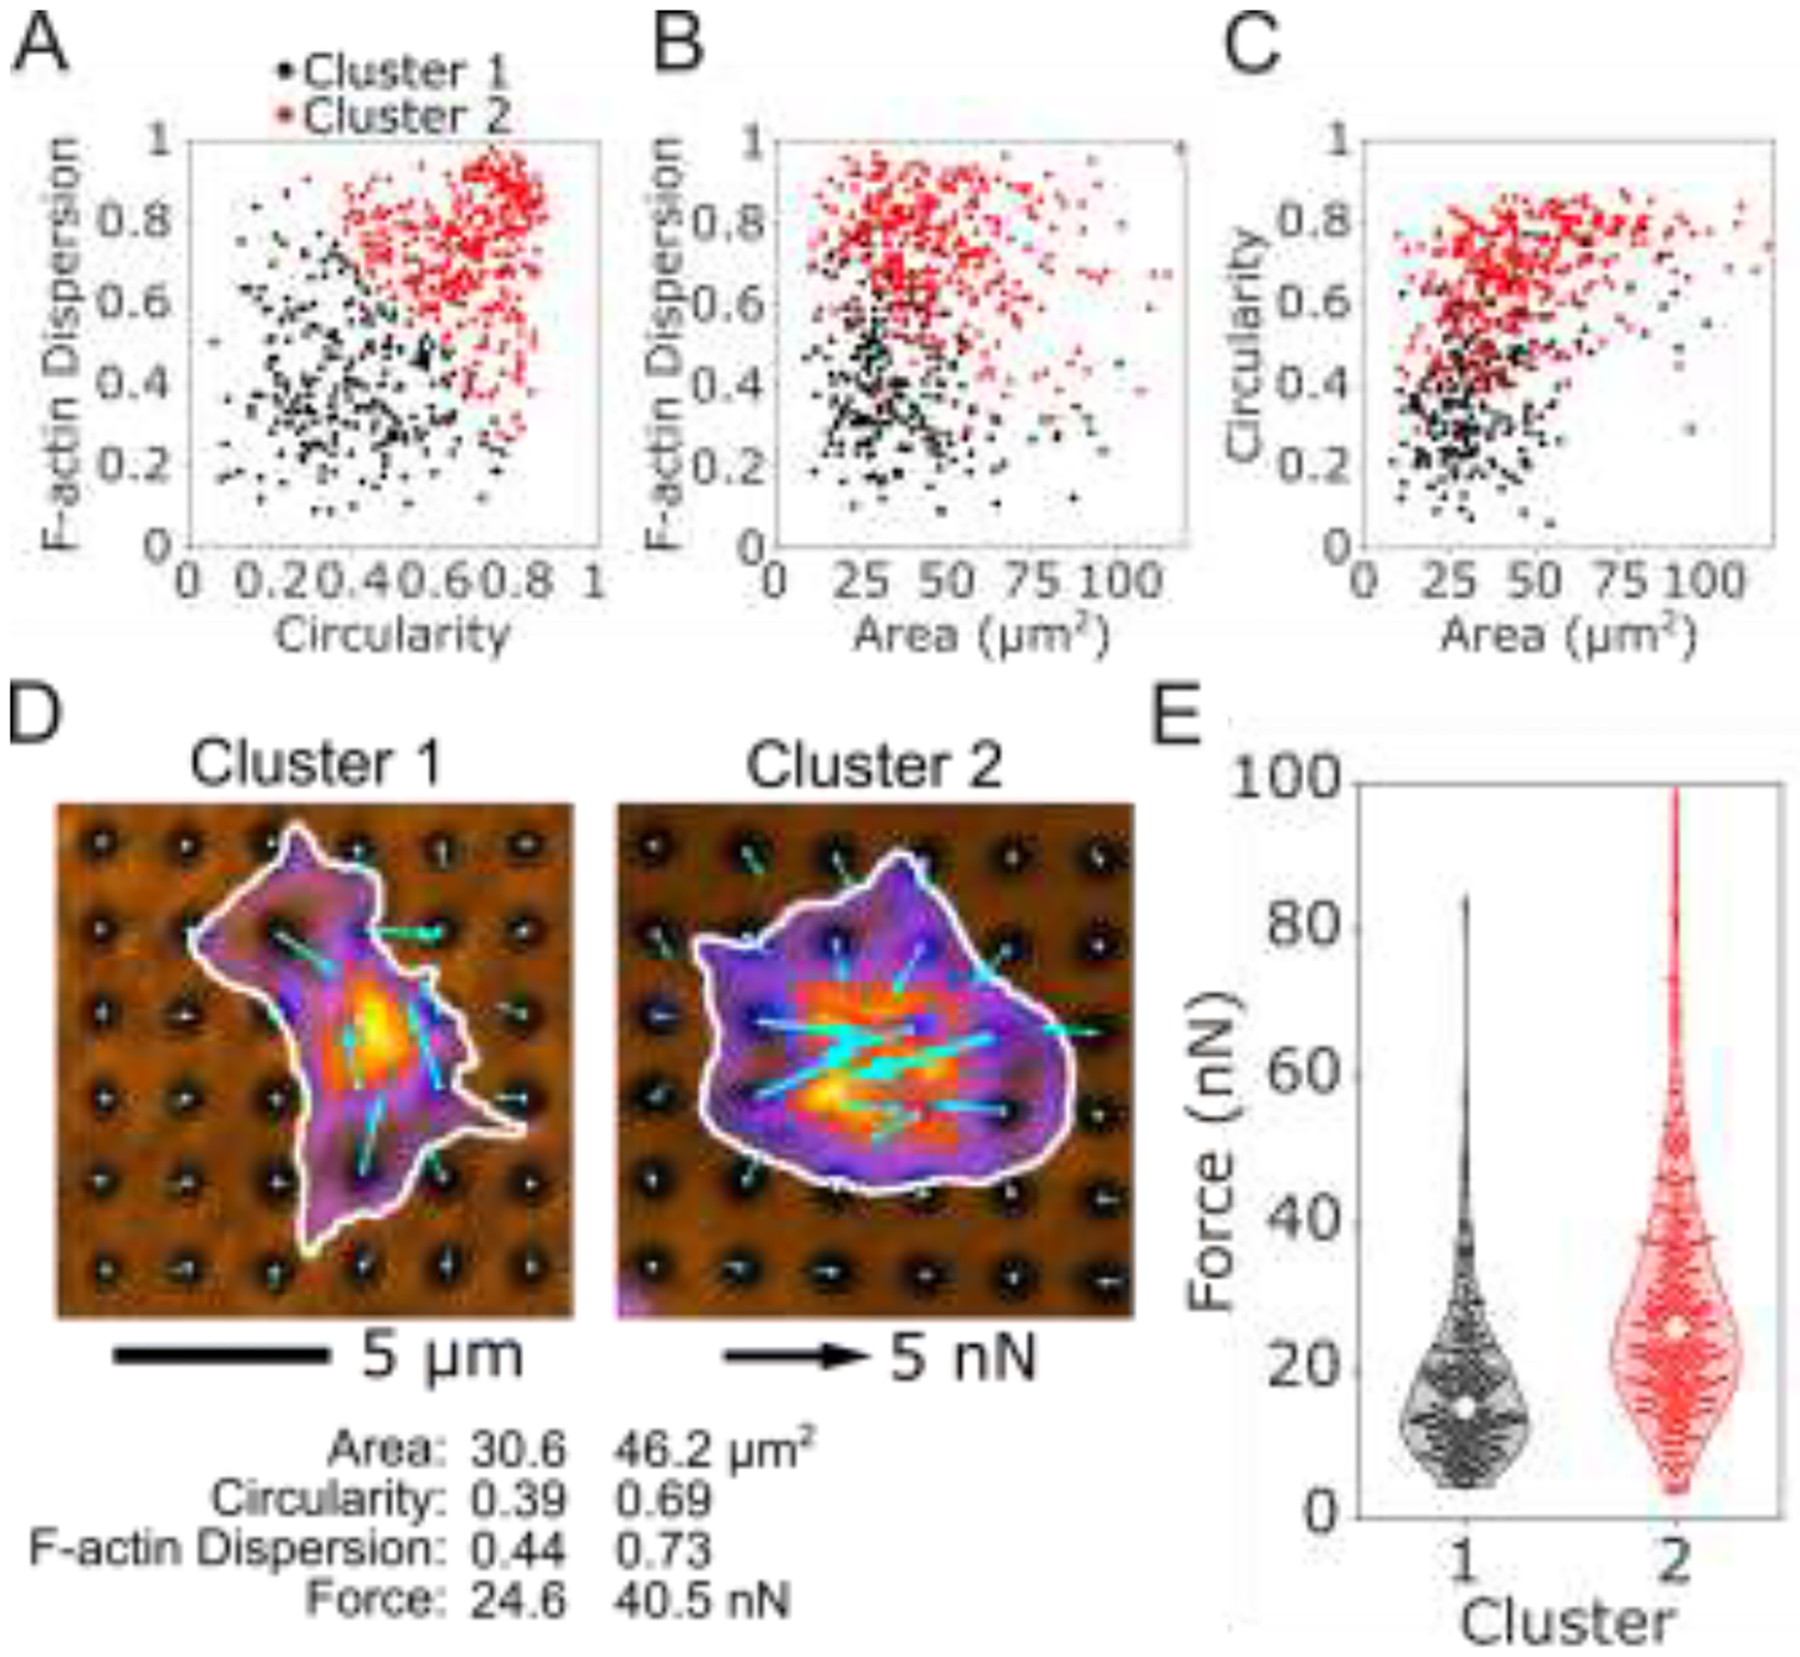
Figure 5 –

K-means clustering of platelet size, shape, and structure predict differences in force. An unbiased K-means clustering approach based on platelet area, circularity, and F-actin dispersion separated the population of platelets into 2 clusters. The two clusters are shown for (A) F-actin dispersion and circularity, (B) F-actin dispersion and area, and (C) circularity and area. (D) The most representative platelet from each cluster is shown. Platelets from cluster 1 have smaller area, lower circularity, and lower F-actin dispersion than cluster 2. (E) Forces from cluster 2 are significantly higher than cluster 1, even though force was not used to determine the clusters.
