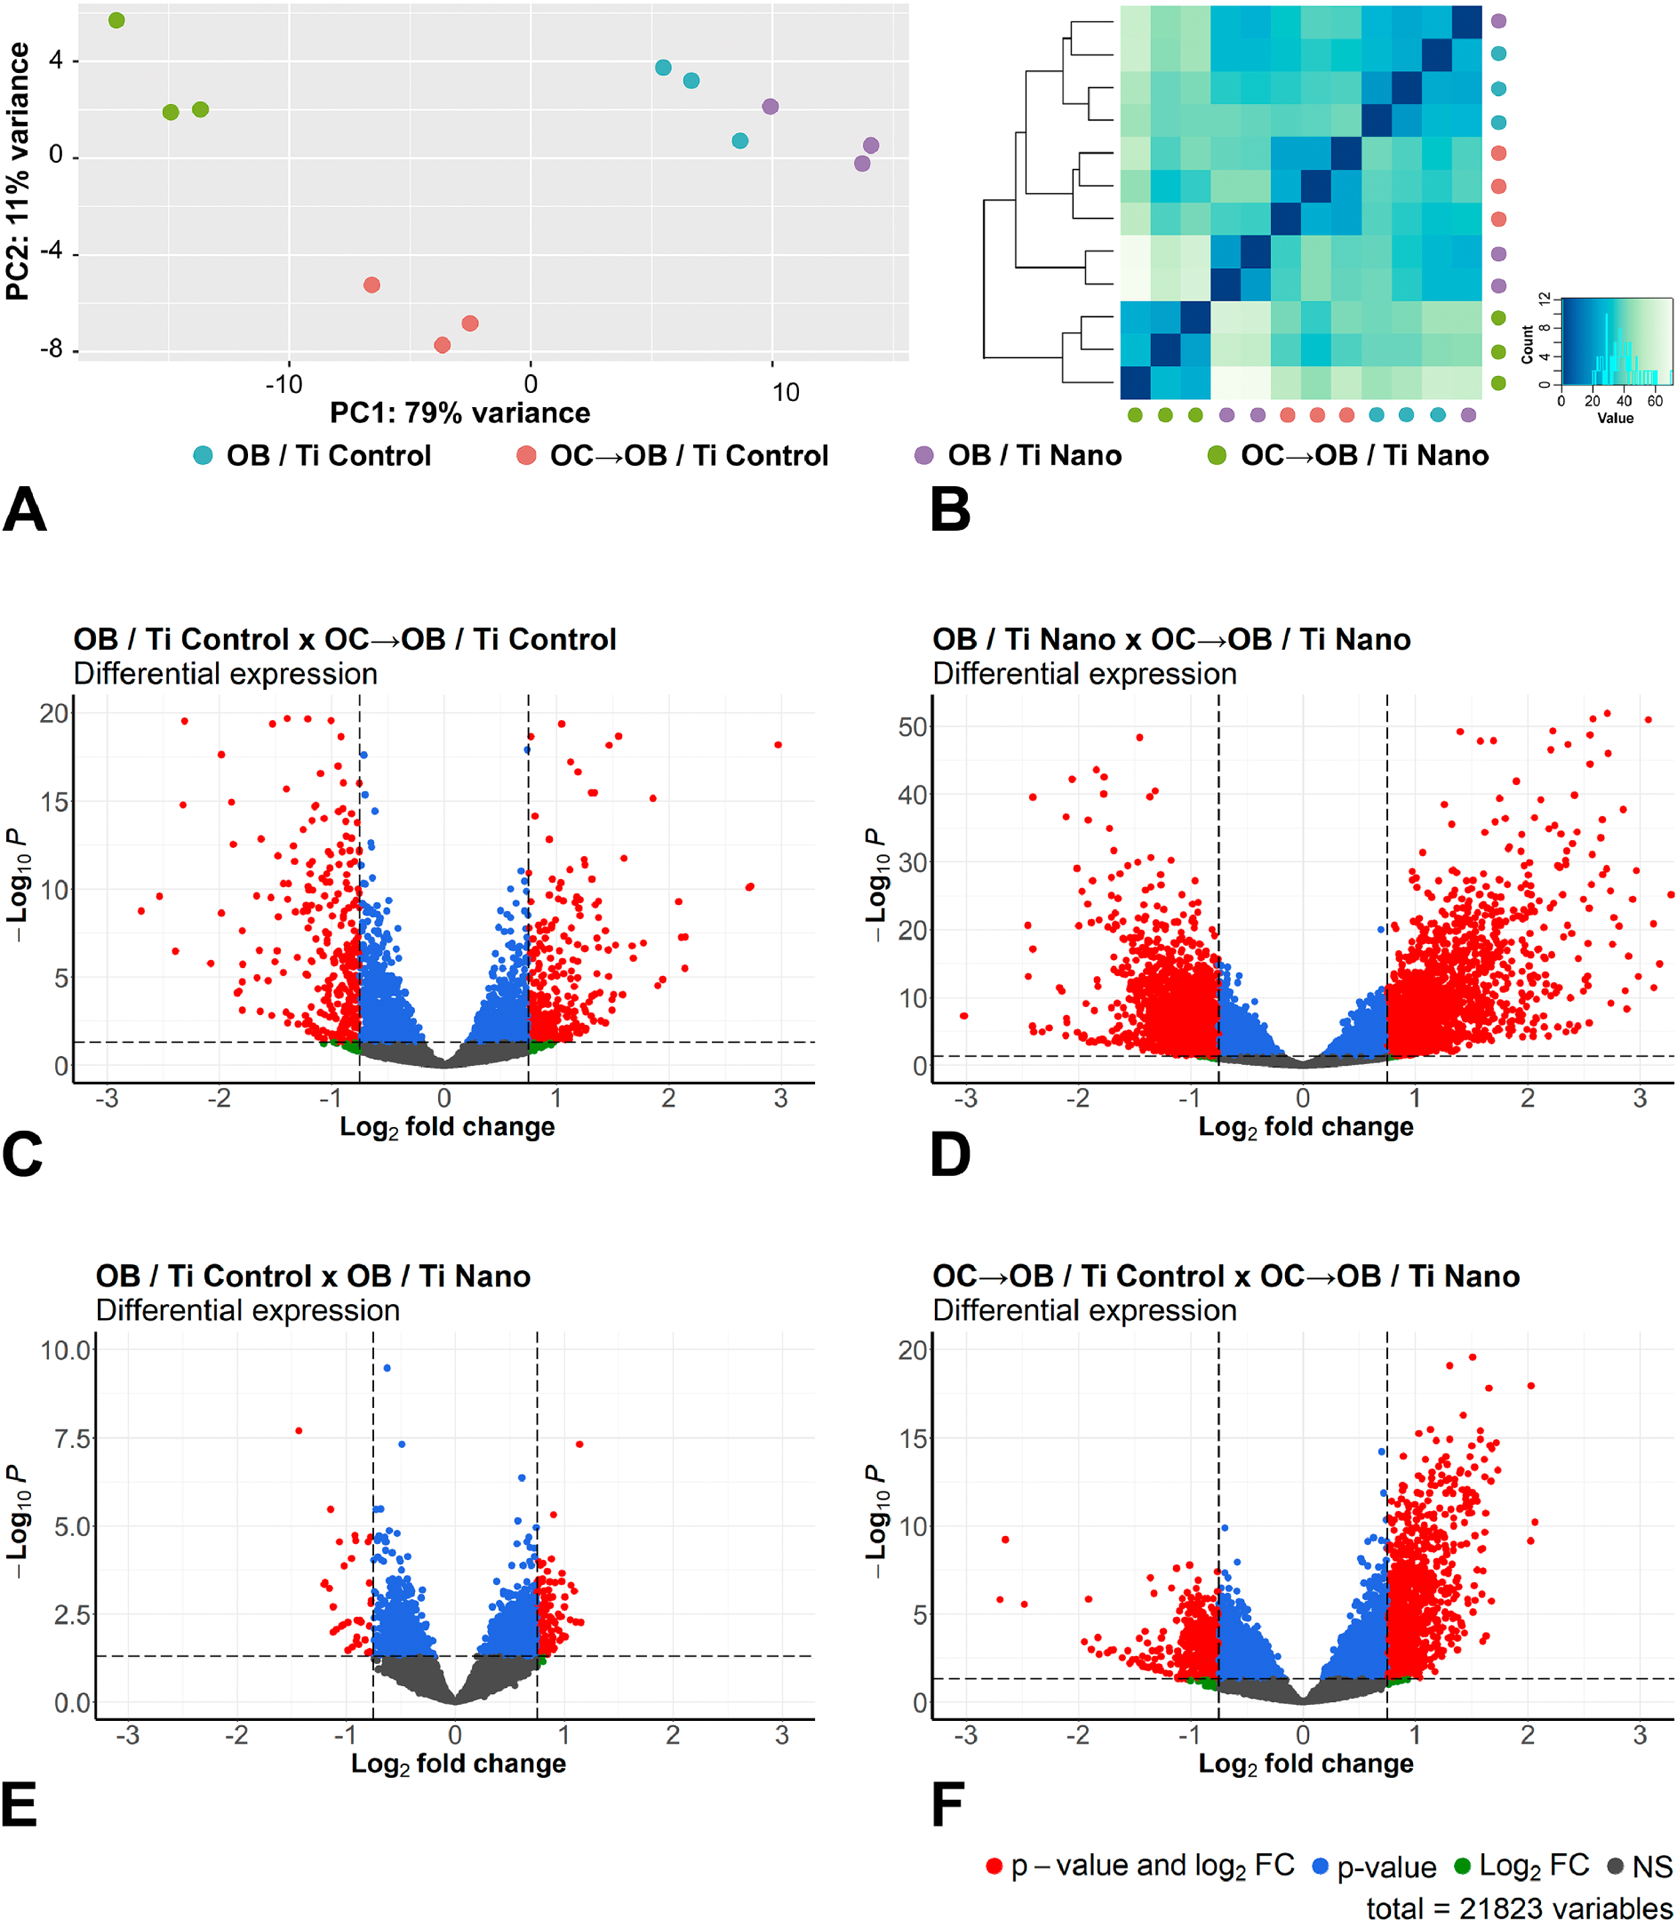
Figure 2.

Osteoclasts induce differential expression of genes in osteoblasts grown on titanium with nanotopography (Ti Nano) compared to polished titanium (Ti Control). Principal component analysis (A) and Euclidean distance metric plot (B) with dots in different colors representing osteoblasts grown on Ti Control (OB / Ti Control), osteoblasts grown on Ti Control in the presence of osteoclasts (OC→OB / Ti Control), osteoblasts grown on Ti Nano (OB / Ti Nano) and osteoblasts grown on Ti Nano in the presence of osteoclasts (OC→OB / Ti Nano) (n = 3); the first component (PC1) showed 79% of variance and the second component (PC2) showed 11% (A). Volcano plots of the RNA-Seq data showing the differential gene expression (n = 3) by comparing OB / Ti Control with OC→OB / Ti Control (C), OB / Ti Nano with OC→OB / Ti Nano (D), OB / Ti Control with OB / Ti Nano (E) and OC→OB / Ti Control with OC→OB / Ti Nano (F). The upregulated genes are represented as red dots on the right and the downregulated ones as red dots on the left, which means that these genes presented statistically significant differences (adjusted p-value) and magnitude of fold change (FC). Blue dots indicate genes that only presented statistically significant differences (adjusted p-value), green dots, the genes that only presented magnitude of FC and the grey ones indicate genes without both statistically significant differences and magnitude of FC (C-F). (For interpretation of the references to colour in this figure legend, the reader is referred to the web version of this article.)
