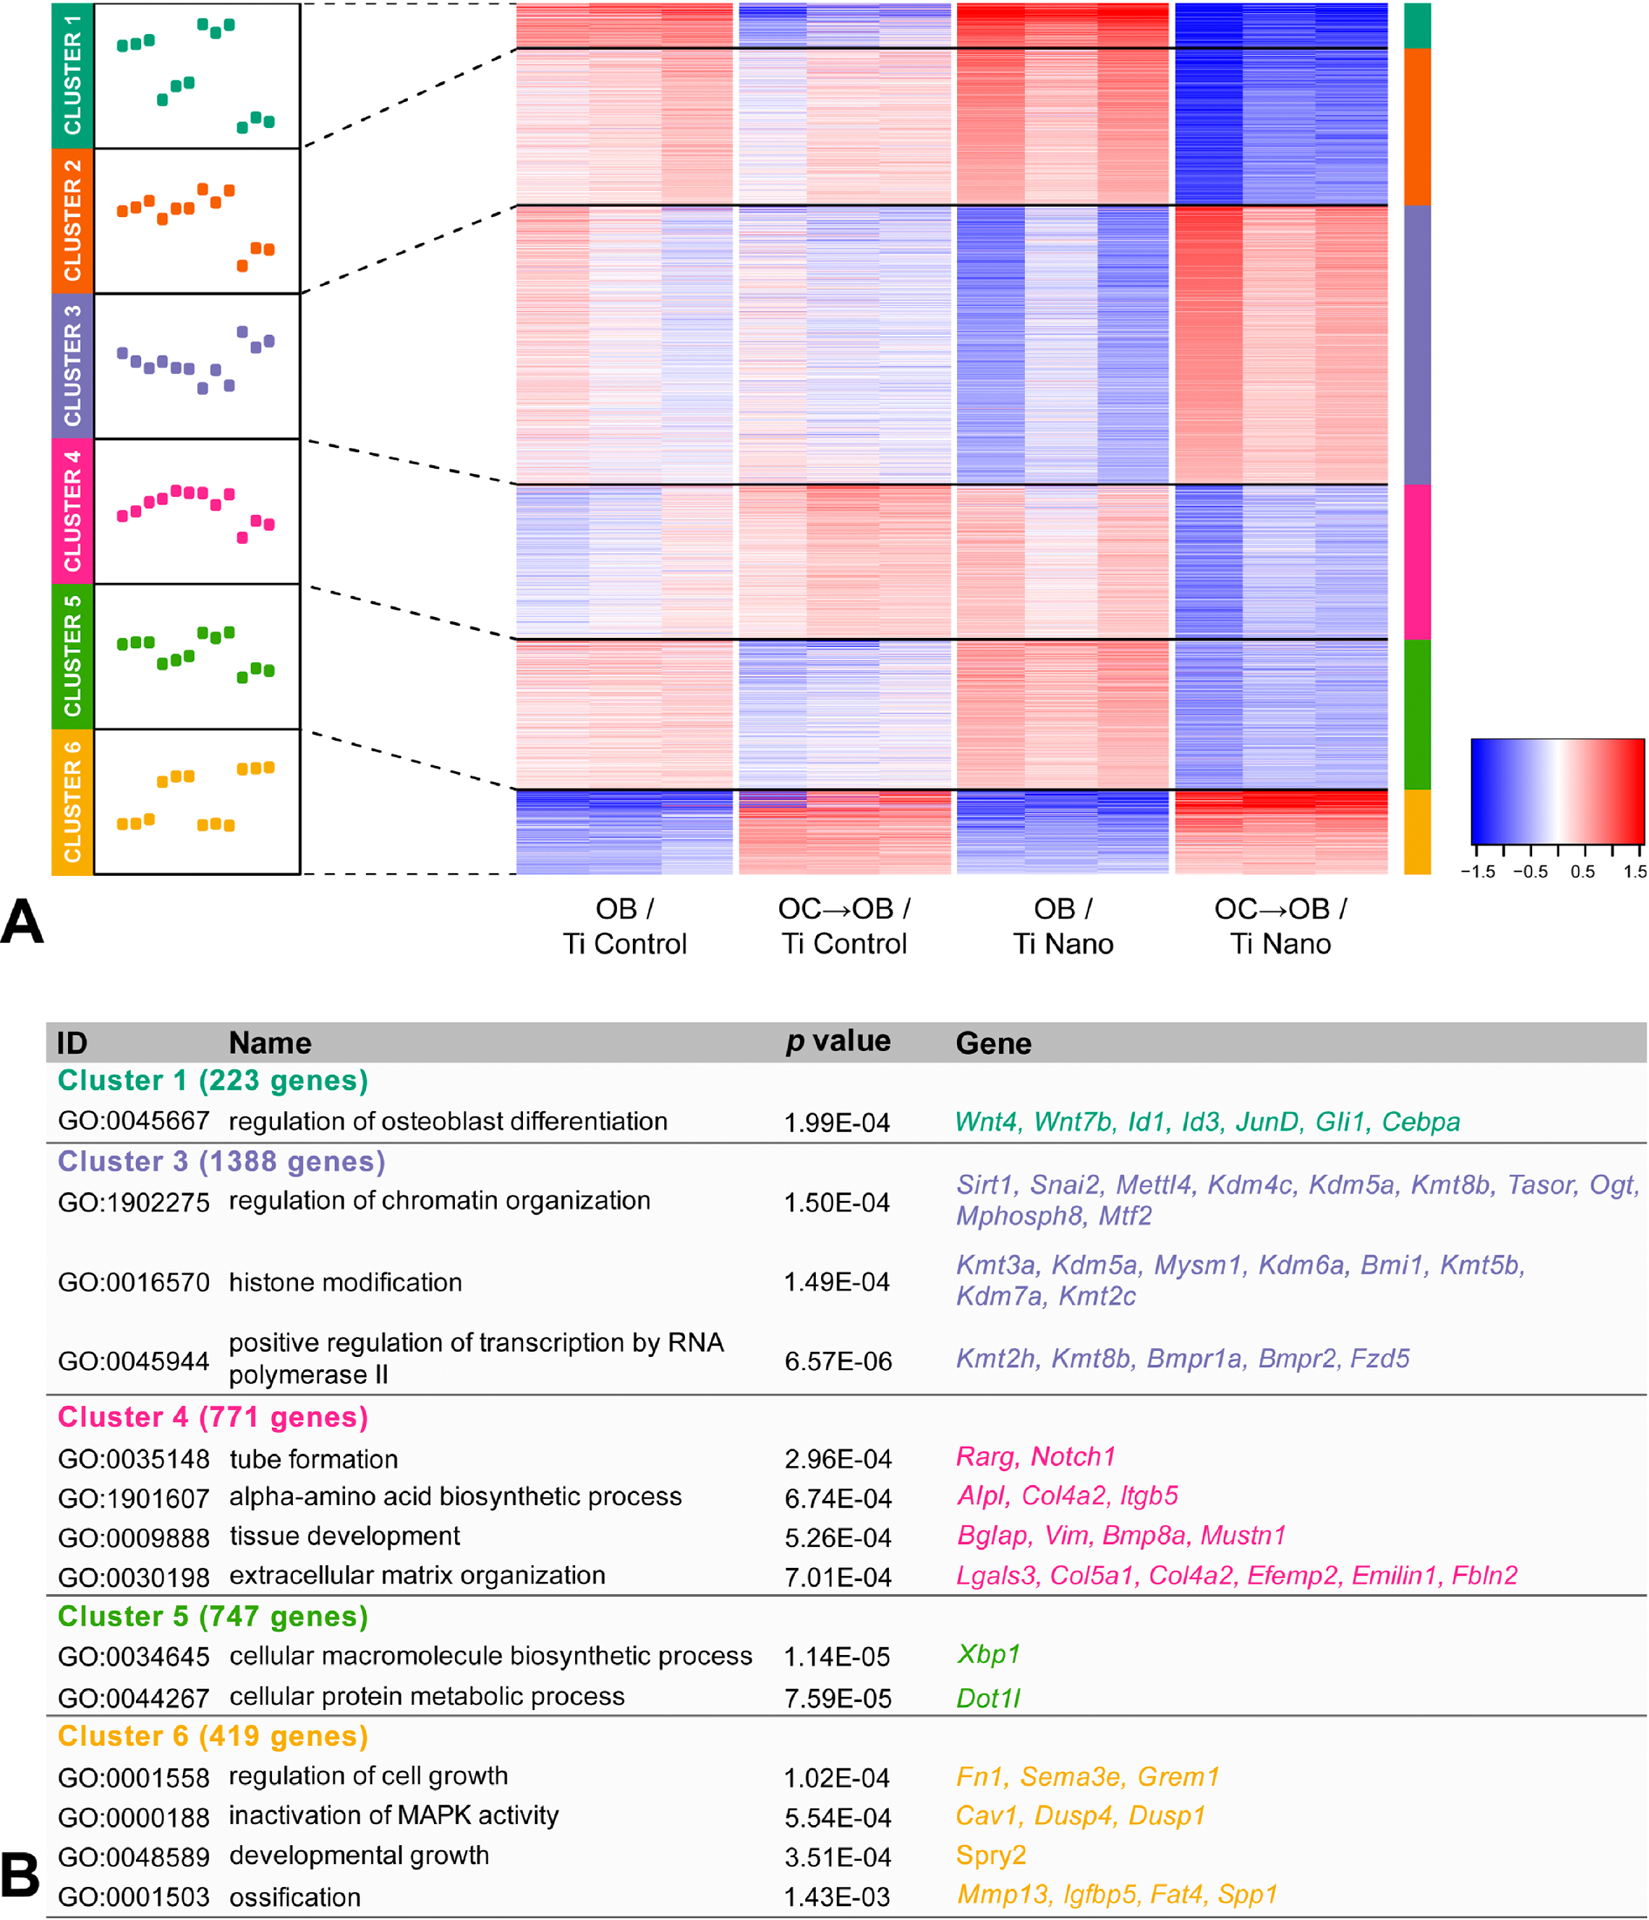
Figure 3.

Osteoclasts induce differential expression of genes in osteoblasts grown on titanium with nanotopography (Ti Nano) compared to polished titanium (Ti Control). Heatmap showing the differential gene expression of osteoblasts grown on Ti Control (OB / Ti Control), osteoblasts grown on Ti Control in the presence of osteoclasts (OC→OB / Ti Control), osteoblasts grown on Ti Nano (OB / Ti Nano) and osteoblasts grown on Ti Nano in the presence of osteoclasts (OC→OB / Ti Nano) (n = 3). Six clusters were defined, and the line plots indicate the gene expression dynamics of each cluster (A). The clusters were submitted to GO analysis and selected GO terms and genes are presented in the table (B). The reader is referred to the web version of this article for the colour representation of this figure.
