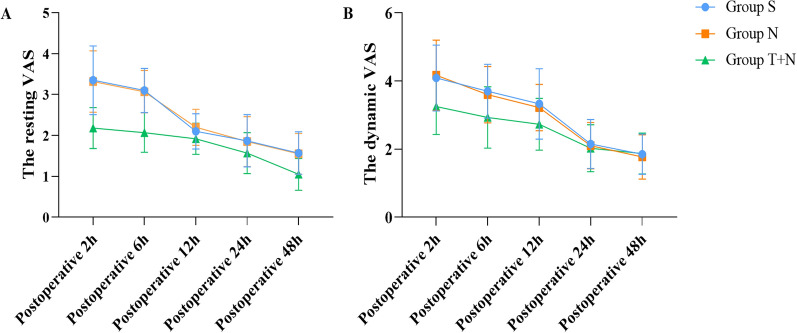
Fig. 2.
Comparison of VAS score at different time points. Mean VAS score for pain intensity at different times postoperatively. Data are presented as mean and SD; whiskers represent SD. a Compared with group S and N, the resting VAS of group T + N was significantly lower (P < 0.05) at 2, 6, 12, 24, and 48 h postoperatively. b Compared with group S and N, the dynamic VAS of group T + N was significantly lower (P < 0.05) at 2, 6, and 12 h postoperatively

