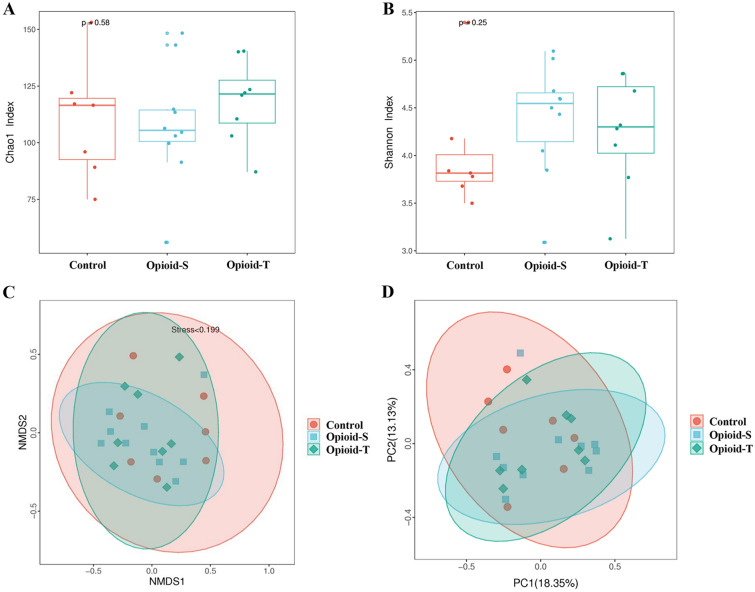
Fig. 4.
Comparison of alpha diversity and beta diversity of gut microbial communities between patients with moderate to severe cancer pain on opioids (opioid groups) and patients without cancer pain (control group). The analysis of alpha diversity in groups was carried out using Chao 1 index (A) and Shannon index (B). The beta diversity of samples was assessed with non-metric multidimensional scaling (NMDS, C) and principal coordinates analysis (PCoA, D) based on the unweighted-UniFrac distances. Orange for the Control, blue for the Opioid-S, and green for the Opioid-T. (Opioid-S (n = 10): Opioid-sensitive group, regular administration of opioid for < 1 week or a daily total dose of < 30 mg oral oxycodone; Opioid-T (n = 8): Opioid-tolerant group, took opioid medication regularly for at least 1 week, with a daily total dose of at least 30 mg of oral oxycodone; Control (n = 7): Cancer patients without cancer pain)

