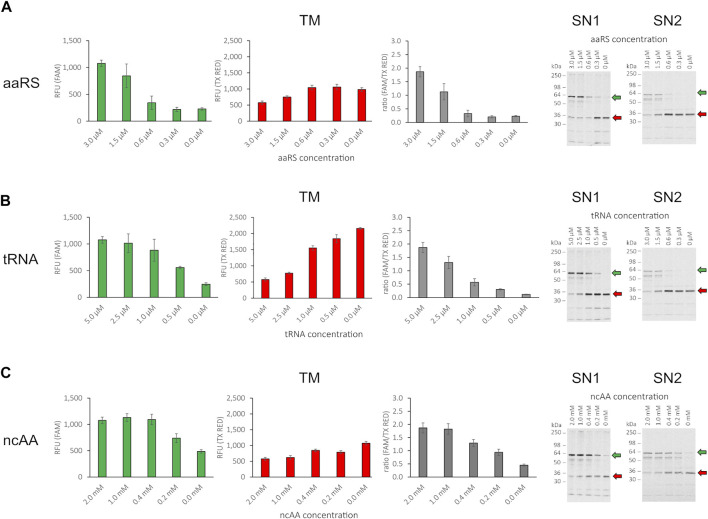
FIGURE 4.
Influence of orthogonal component concentration on fluorescence of RFP-X-GFP reporter protein in the translation mix (TM) and SDS-PAGE of corresponding supernatant fractions SN1 and SN2. (A) Variation of aaRS concentration with 5 µM tRNA and 2 mM ncAA, (B) variation of tRNA concentration with 3 µM aaRS and 2 mM ncAA, (C) variation of ncAA concentration with 3 µM aaRS and 5 µM tRNA for the translation mix (TM) in the FAM channel, the Texas Red channel, ratio of RFU (FAM/TX Red), and the corresponding visualization of the SN1 and SN2 fraction in a radiography of 10% SDS-PAGE (from left to right). Mean values of triplicates were background fluorescence subtracted and are plotted with error bars representing their standard deviation. Green and red arrows depict the full length protein and the termination product, respectively.

