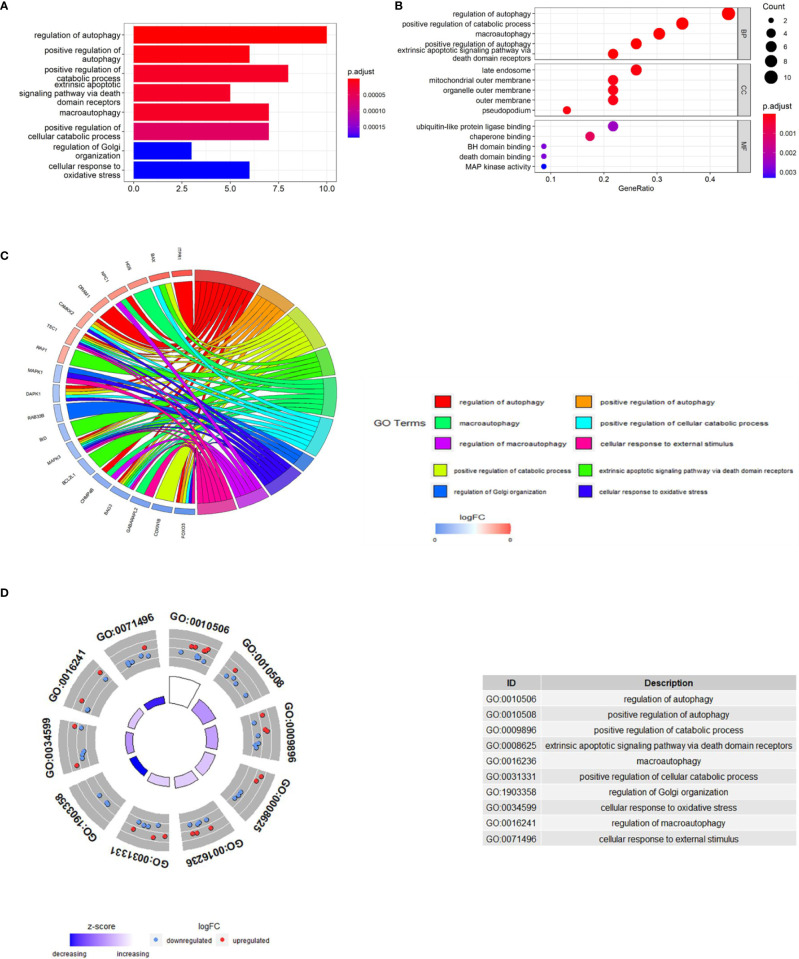
Figure 4.
GO enrichment analysis of 23 differentially expressed autophagy-related genes, including BPs, CCs and MFs. (A), Bar plot of enriched GO terms. (B), Bubble plot of enriched GO terms. (C), Chordal graph of enriched GO terms. It shows the relationship between DEGs and the first 10 enriched GO pathways. (D), Eight Diagrams of enriched GO terms. GO, Gene Ontology; BPs, biological processes; CCs, cellular components; MFs, molecular functions; DEGs, differentially expressed genes.

