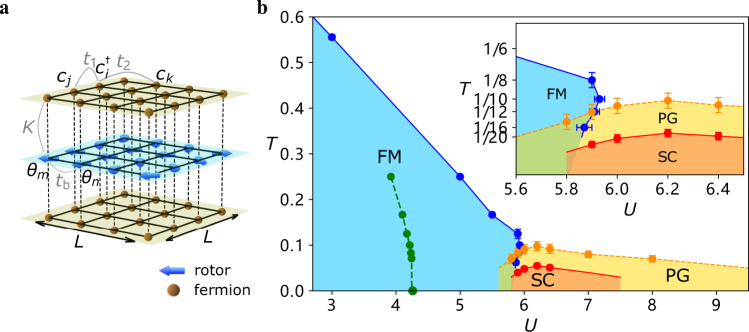
Fig. 1. Model and Phase diagram.
a Sketch of the model in Eq. (1). Deep yellow dots and grids of the top and bottom layers represent fermion degrees of freedom with nearest hopping strength t1 (e.g., ) and next-nearest hopping t2 (e.g., ). Blue arrows and grid in the middle layers denote bosonic parts with an unit vector representing θ ∈ [0, 2π) of the rotor on each site. The interaction between two rotors on nearest sites (e.g., θm and θn) is tb. The on-site coupling K between fermions and bosons is shown by the vertical dashed lines. The system size is L × L. b U − T phase diagram of the model obtained from QMC simulation. The inset zooms in to the vicinity of the pseudogap (PG, yellow), ferromagnetic (FM, blue) and superconducting (SC, orange) regions. The blue points on the FM phase boundary are determined by finite size scaling with fixed T or U. Notably, for U = 5.9, as temperature gets lower, the system first enters into the FM phase at T ≈ 0.13, then exits it at T ≈ 0.08. The yellow points of the PG boundary are determined from the onset of a PG in the single-particle spectrum, as shown in Fig. 2. The red points denoting an onset of s-wave superconductivity are determined from the onset of a full gap in the spectrum as well as Kosterlitz-Thouless scaling of the pairing susceptibility. The maximum of SC phase transition temperature Tc is ~0.05. The green points and dashed line, are the phase boundary of the (uncoupled) quantum rotor model13. See the Supplementary Note 3 for additional details as well as a discussion of SC fluctuations above Tc. The errorbars of the points on the FM phase and SC phase boundaries are determined by the data collapse with fixed T or U. For the PG phase boundary, the errorbars come from the uncertainty in identifying the onset of the minimum at ω = 0 for distinct temperatures of DOS.

