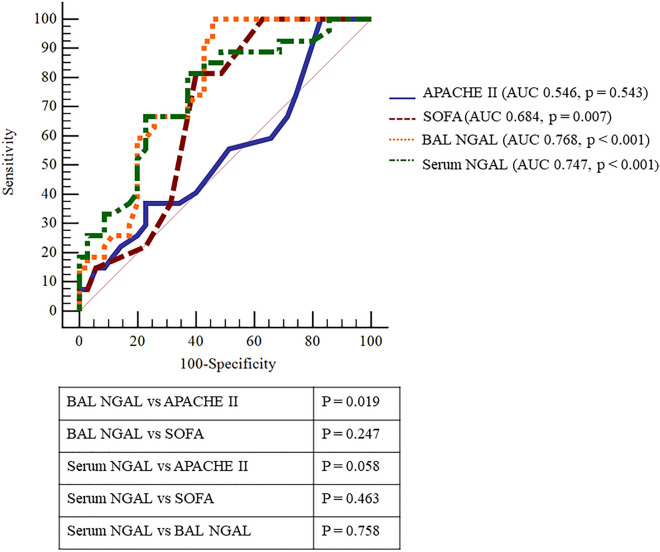
Figure 4.
Receiver operating characteristic curve for intensive care unit mortality. At baseline, BAL NGAL (AUC 0.768, 95% CI 0.643–0.866, p < 0.001) and serum NGAL (AUC 0.747, 95% CI 0.621–0.849, p < 0.001) levels showed fair predictive power. SOFA score (AUC 0.684, 95% CI 0.554–0.796, p = 0.007) also showed significant predictive power. Baseline NGAL levels showed comparable predicted power compared to SOFA scores (serum P = 0.463, BAL p = 0.247). In addition, serum NGAL showed a predicted power comparable to that of BAL NGAL (p = 0.758). AUC area under the curve, BAL bronchoalveolar lavage, NGAL neutrophil gelatinase-associated lipocalin, APACHE II Acute Physiology and Chronic Health Evaluation II, SOFA sequential organ failure assessment.

