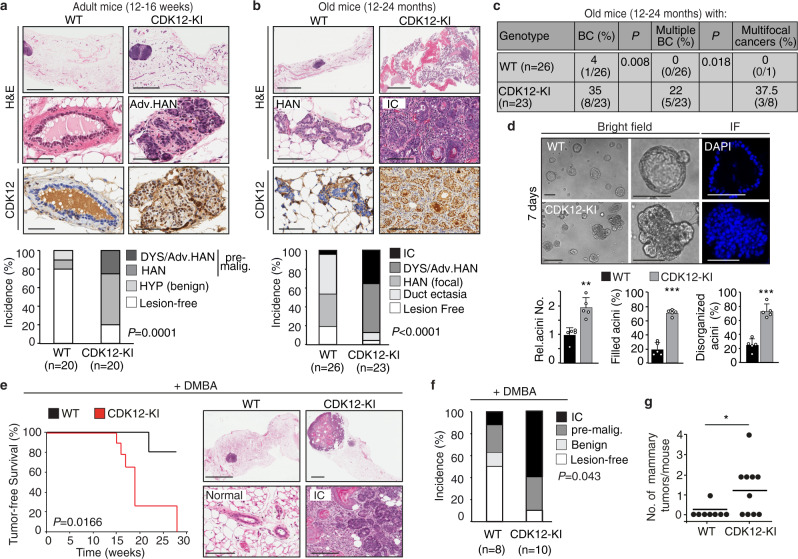
Fig. 1. CDK12 overexpression enhances spontaneous and carcinogen-induced breast tumorigenesis.
Top, Representative mammary gland histology of age-matched adult (a) and old (b) female nulliparous CDK12 knock-in (CDK12-KI) vs. wild-type (WT) FVB mice; upper/middle images, hematoxylin and eosin (H&E); lower images, IHC with an anti-human CDK12 specific antibody. Bars (a): upper images, 2 mm; middle/lower images, 50 µm; Bars (b): upper images, 4 mm; middle/lower images, 100 µm. Bottom, Quantitation of the experiment performed by scoring the highest degree lesion observed in each mouse. HYP, hyperplasia; HAN, hyperplastic alveolar nodule; DYS, dysplasia; Adv. HAN, advanced HAN; pre-malig., pre-malignant; IC, infiltrating carcinoma. P, P-values, Pearson’s test; n, number of mice in each group. c Frequency (%) of breast cancers (BC) in old CDK12-KI (n = 23) vs. WT (n = 26) mice as in (b). The presence of multiple or multifocal breast cancers is expressed as a percentage of total positive mice. P, P-values, two-tailed Fisher’s test. d Top, Typical 3D-Matrigel outgrowth morphology from primary mammary epithelial cells (MECs) isolated from age-matched adult CDK12-KI vs. WT female mice. In immunofluorescence (IF) images, DAPI nuclear staining is shown in blue. Bottom, total number (Rel. Acini No.) and percentage of filled and disorganized acini from CDK12-KI vs. WT MECs. Data are means ± SD. **P = 0.001; ***P < 0.001, two-sided unpaired t-test (n = 5). e Left, Kaplan–Meier analysis of tumor-free survival of CDK12-KI (n = 11) vs. WT (n = 8) mice treated with DMBA (1 mg/dose/week) for 6 weeks. Sacrifice time at the maximum tolerable tumor burden. P, P-value, log-rank test. Right, Representative histology of DMBA-treated CDK12-KI mice showing an infiltrating carcinoma (IC) vs. WT female mice showing normal/hyperplastic alveoli. Bars, upper panels: right, 1 mm, left 3 mm; lower panels: right, 150 µm; left, 100 µm. f Distribution of mammary lesions detected at sacrifice time in CDK12-KI (n = 10) vs. WT (n = 8) mice treated as in (e). Data are as in (a, b). P, P-value for incidence of IC + pre-malignant lesions in CDK12-KI vs. WT, two-tailed Fisher’s test. g Number of tumors in individual CDK12-KI vs. WT mice treated as in (e). *P = 0.0286, two-sided unpaired t-test. Source data are provided as Source Data file.

