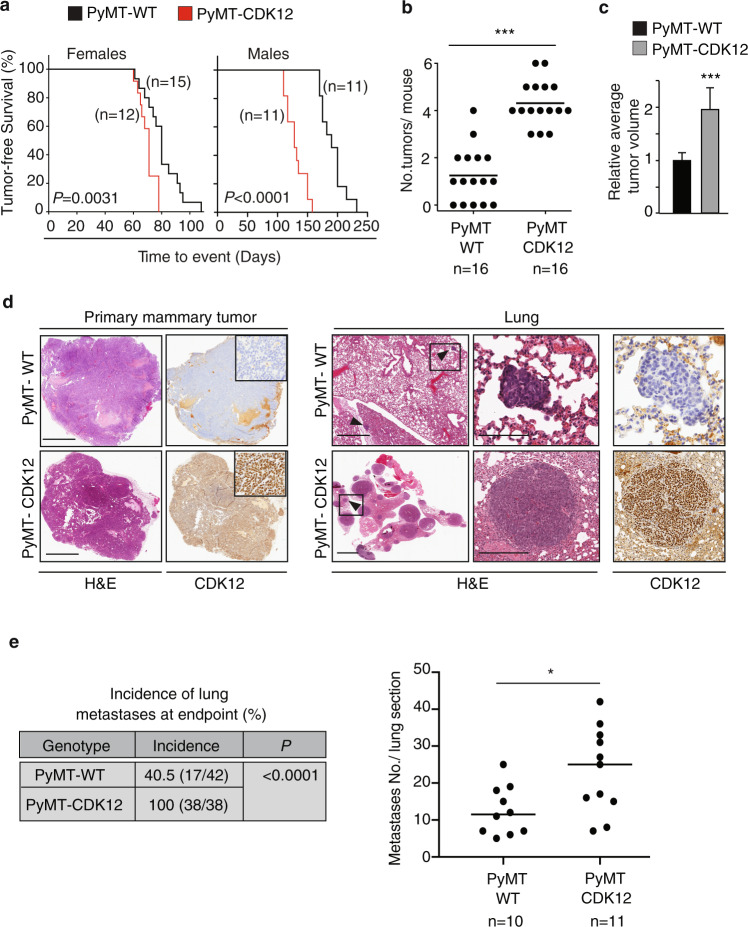
Fig. 2. CDK12 overexpression increases tumor onset and multiplicity and metastatic spreading in PyMT oncogene-driven mammary tumorigenesis.
a Kaplan–Meier analysis of tumor-free survival of female (left) and male (right) PyMT/CDK12-KI vs. PyMT/WT control mice. All mice are heterozygous for the Cre recombinase transgene. Mice were sacrificed when the maximum tolerable tumor burden was reached (~1.2 cm). The number of mice in the different groups are indicated. Comparison of survival curves, log-rank test. P = 0.0031, in Females; P < 0.0001, in Males. b Distribution of the number of mammary tumors/mouse detected in individual PyMT/CDK12-KI (n = 16) vs. PyMT/WT (n = 16) mice at a fixed sacrifice time (~5 weeks old). ***P < 0.001, two-sided unpaired t-test. c Relative average tumor volume in PyMT/CDK12-KI (n = 12) vs. PyMT/WT (n = 12) mice at the time of sacrifice. Data are means ± SD. ***P < 0.001, unpaired t-test. d Representative images of primary mammary tumors (left panels) and synchronous lung metastases (Lung, right panels) in PyMT/CDK12-KI and PyMT/WT mice. Left panels, inserts show a magnification of the tumor areas. Right panels, arrowheads indicate metastatic lesions; boxed areas are magnified on the right. H&E, hematoxylin and eosin staining; CDK12, anti-CDK12 IHC staining. Bars in primary mammary tumor panels, 2 mm; bars in Lung panels: left images, 2 mm; middle/right images: top, 150 µm (PyMT/WT); bottom, 300 µm (PyMT/CDK12-KI). e Left, Quantitative analysis of the incidence of lung metastases in PyMT/CDK12-KI vs. PyMT/WT mice. The number of mice in each group is indicated. P, P-value, two-tailed Fisher’s test. Right, quantification of metastases in lung sections from PyMT/CDK12-KI (n = 11) vs. PyMT/WT mice (n = 10). *P = 0.018, two-sided unpaired t-test. Source data are provided as Source Data file.

