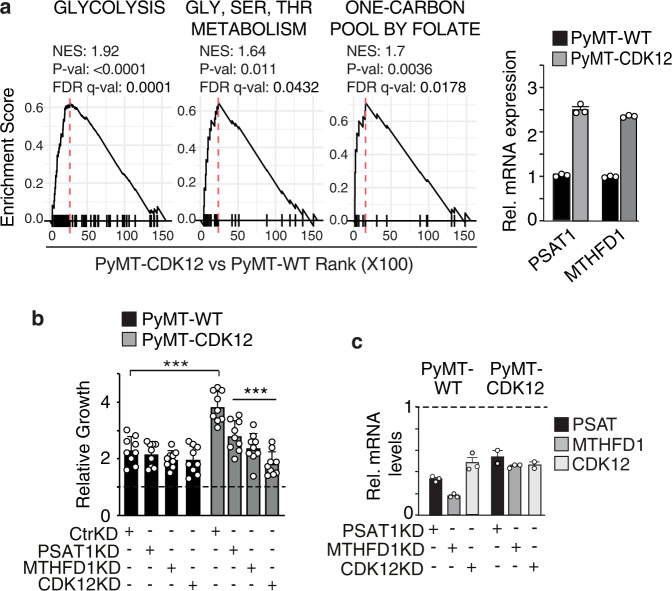
Fig. 6. CDK12 overexpression induces metabolic dependency on the SGOC network in PyMT/CDK12.
a Left, GSEA of RNA-seq data (n = 2) from PyMT-CDK12 vs. PyMT-WT tumor cells, obtained from a pool of 3 different tumors for each strain, showing significant association of CDK12 overexpression with enrichment of gene sets involved in glycolysis (Reactome), glycine-serine-threonine metabolism (Gly-Ser-Thr metabolism, KEGG), one-carbon metabolism (one-carbon pool by folate, KEGG). Right, RT-qPCR analysis of PSAT1 and MTHFD1 in PyMT-CDK12 vs. PyMT-WT cells. mRNA levels are reported relative to control in each condition ± SEM (n = 1, out of two independent experiments). b Three-day proliferation of PyMT-CDK12 vs. PyMT-WT MECs silenced for PSAT1 (PSAT1-KD), MTHFD1 (MTHFD1-KD) and CDK12 (CDK12-KD). Data are expressed as relative to day 0 in each condition (=1, dashed line) and are the mean ± SD (n = 3). Statistical significance, two-sided unpaired t-test, relative to Ctr-KD in each condition, and relative to WT in the same experimental condition for Ctr-KD PyMT-CDK12 cells. ***P < 0.001 relative to matching control. c RT-qPCR showing efficiency of PSAT1, MTHFD1 and CDK12 knockdown in PyMT/CDK12 and PyMT/WT MECs. Data are expressed as relative to control-silenced cells (Ctr-KD = 1, indicated by horizontal dashed line) for each condition (one experiment performed in technical triplicates).

