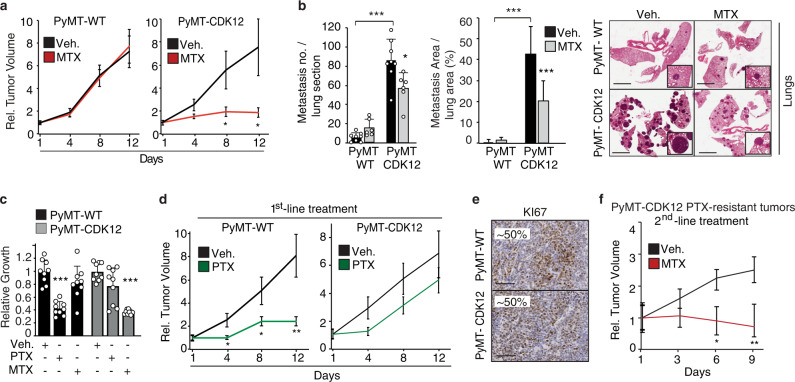
Fig. 7. CDK12 overexpression induces metabolic vulnerability to methotrexate (MTX) treatment in PyMT/CDK12 mice.
a PyMT/CDK12 vs. PyMT/WT xenograft response to MTX (10 mg/kg) or control vehicle (Veh.) (n ≥ 8 tumors/condition). Data, expressed as relative to day 1 of treatment, are the mean ± SEM. *P = 0.019 (8 days); P = 0.013 (12 days) relative to matching control, two-sided unpaired t-test (Scatter plots and fitting curves in Source data). b Number (left) and total area (middle) of synchronous lung metastases detected at the endpoint in the experiment in (a). Data are the mean ± SD; *P = 0.019; ***P < 0.001, two-sided unpaired t-test, relative to vehicle in each condition, and relative to WT in the same experimental condition for vehicle-treated PyMT-CDK12 mice. *P = 0.019; ***P < 0.001. Left, n = lung sections, WT: Veh. n = 8, MTX n = 6; CDK12: Veh. n = 8, MTX n = 6. Middle, n = lung sections, WT: Veh. n = 14, MTX n = 11; CDK12: Veh. n = 12, MTX n = 13. Right, Histology showing the lung metastatic burden for each condition. Inserts, magnification of typical metastatic lesions in dashed boxed. Bars, 3 mm. c Three-days in vitro growth of PyMT/CDK12 vs. PyMT/WT tumor cells treated with paclitaxel (PTX, 20 nM), or MTX (1 μM) vs. vehicle. Data, expressed as to relative 72 h of treatment of each cell line, are the mean ± SD (n = 3). ***P < 0.001 vs. matching condition, two-sided unpaired t-test. d PyMT/CDK12 vs. PyMT/WT xenograft response to first-line PTX (5 mg/kg) and MTX (10 mg/kg) (n ≥ 8 tumors/condition). Data, expressed as relative to day 1 of treatment, are the mean ± SEM. *P < 0.05; **P < 0.01 relative to matching vehicle-treated controls, two-sided unpaired t-test (Scatter plots and fitting curves in Source data). e Representative IHC images for KI67 in PyMT/CDK12-KI vs. PyMT/WT tumor xenografts. The percentage of KI67-positive cells is indicated. Bars, 150 μm. f Growth response in PTX-resistant PyMT/CDK12 xenografts from (d), randomized to second-line MTX (10 mg/kg) or no treatment (Veh.). Data, expressed as relative to day 1 of treatment (n ≥ 4 tumors/condition), are the mean ± SEM. *P = 0.020; **, P = 0.003 relative to vehicle-treated tumors, two-sided unpaired t-test (Scatter plots and fitting curves in Source data). Source data are provided as Source Data file.

