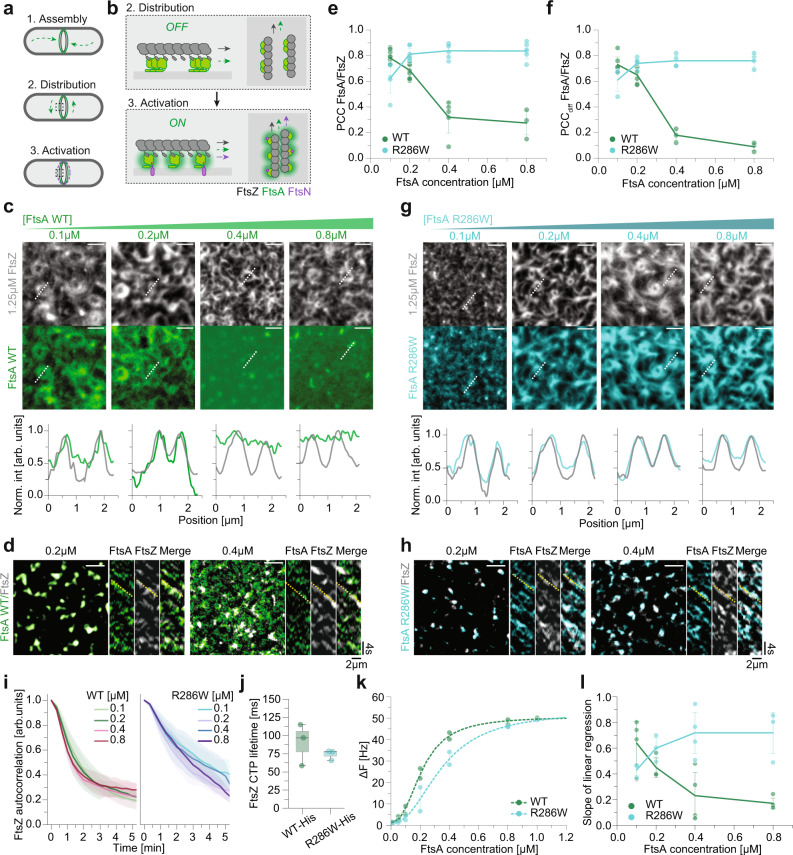
Fig. 1. Membrane patterning of FtsA by treadmilling filaments of FtsZ.
a, b Current model of divisome activation. FtsA anchors FtsZ to the cytosolic membrane of E. coli, and treadmilling FtsZ filaments distribute FtsA around midcell. b Side (left) and top-view (right). FtsN binding is expected to switch FtsA from an oligomeric off to the monomeric on state. c Representative micrographs of Alexa488-FtsZ (grey) and Cy5-FtsA WT (green) at increasing FtsA and constant FtsZ concentrations. Intensity profiles correspond to dashed white lines. d Representative micrographs showing merged differential image of FtsZ with 0.2 µM (left) and 0.4 µM (right) FtsA. Yellow lines in kymographs indicate the slope for treadmilling FtsZ. e Colocalization of WT (green) and R286W (cyan) with FtsZ quantified by PCC. n(WT) = 11/9/5/3 and n(R286W) = 5/8/6/6 for 0.1/0.2/0.4/0.8 µM respectively. f Dynamic colocalization of WT (green) and R286W (cyan) with FtsZ quantified by PCCdiff. n(WT) = 6/6/3/3 and n(R286W) = 3/5/4/4. g Representative micrographs of Alexa488-FtsZ (grey) and Cy5-FtsA R286W (cyan) at increasing FtsA and constant FtsZ concentrations. Intensity profiles correspond to dashed white lines. h Representative merged differential images of FtsZ and 0.2 µM (left) or 0.4 µM (right) FtsA R286W. Yellow lines in kymographs indicate the slope for treadmilling FtsZ. i The FtsZ network is more persistent with FtsA R286W, showing a slower autocorrelation decay. n(WT) = 8/8/4/2 and n(R286W) = 7/7/6/6. j The FtsZ-C-terminal peptide has the same lifetime on 1% Tris-NTA lipids membranes with WT-His6 or R286W-His6. n(WT/R286W) = 3. k QCM-D experiments reveal that R286W binds slightly weaker to bilayers compared to WT. However, membranes are saturated at 0.8 µM for both FtsAs. n(WT/R286W) = 2. l The slope of the linear regression is proportional to the [FtsZ] vs [FtsA] ratio. n(WT) = 4/3/4/4 and n(R286W) = 3/3/4/3. Scale bars are 2 µm. Dots represent independent experiments, thick lines indicate means, error bars or shaded areas (i) depict the standard deviation. The boxes indicate the 25–75th percentiles, whiskers show the maximum/minimum values within the standard deviation and the midline indicates the median. Source data are provided as a Source Data file.

