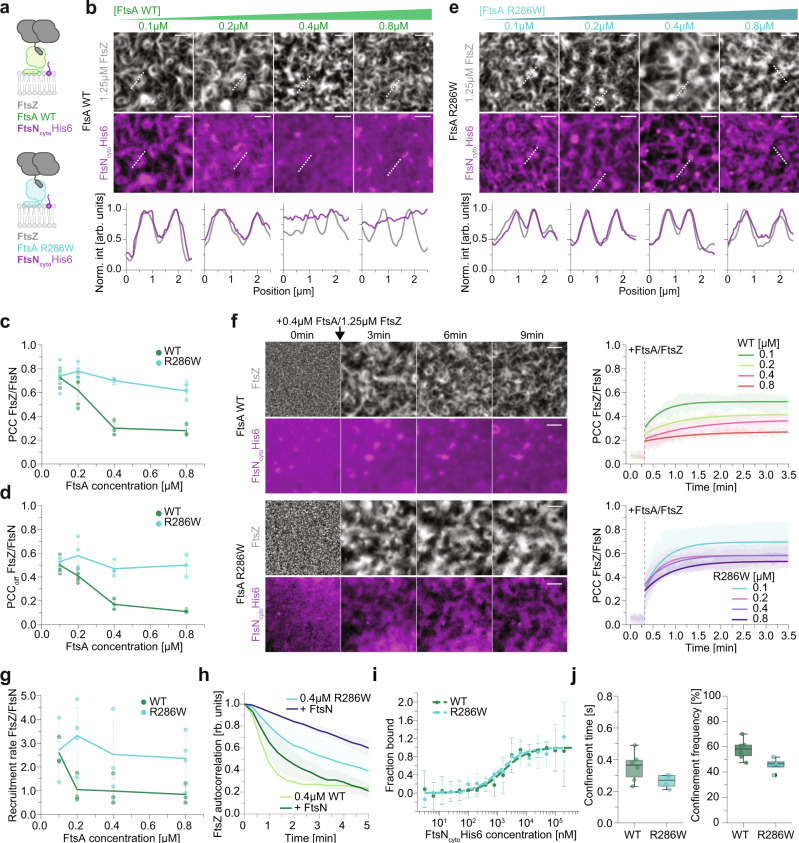
Fig. 2. FtsA R286W shows enhanced recruitment of FtsNcyto to FtsZ filaments.
a Schematic illustrating added components and fluorescently labelled proteins (bold) in experiments shown in b and e. b Representative micrographs of Alexa488-FtsZ (grey) and Cy5-FtsNcyto (magenta) at increasing FtsA WT and constant FtsZ concentrations. Intensity profiles correspond to the dashed white lines. c Colocalization of FtsZ and FtsNcyto in the presence of FtsA WT (green) or FtsA R286W (cyan) quantified by PCC. n(WT) = 5/5/3/3 and n(R286W) = 6/4/4/5. d Dynamic colocalization of FtsZ and FtsNcyto in the presence of FtsA WT (green) or FtsA R286W (cyan) quantified by PCCdiff. n(WT) = 5/5/3/3 and n(R286W);= 4/4/4/3. e Representative micrographs of Alexa488-FtsZ (grey) and Cy5-FtsNcyto (magenta) at increasing FtsA R286W and constant FtsZ concentration. Line profiles were taken along dashed white lines. f Top: Cy5-FtsNcyto (magenta) is not enriched on FtsZ filaments after adding Alexa488-FtsZ (grey) and 0.4 µM FtsA WT at 0 min. Bottom: In experiments with 0.4 µM FtsA R286W, Cy5-FtsNcyto colocalizes well with FtsZ filaments. Right: Increase of PCC after addition of FtsZ and different FtsA WT (top) or R286W (bottom) concentrations. Thick lines depict power law exponential fits towards the mean PCC, shaded area is the standard deviation. g Quantification of the recruitment rate of FtsNcyto towards FtsZ filaments, extracted from experiments in f by fitting a power law exponential to individual experiments. n(WT) = 3/3/3/3 and n(R286W) = 2/4/3/4. h FtsNcyto increases the persistency of the FtsZ network with both, FtsA WT and R286W. n(WT/R286W) = 3. i Quantification of the binding affinity of FtsNcyto towards FtsA WT or R286W by MST. n(WT, R286W) = 3. j Quantification of the duration and frequency of FtsNcyto single molecule confinement events. n(WT/R286W) = 6/4.Scale bars are 2 µm. Dots in all plots represent independent experiments, thick lines indicate the mean and error bars or shaded areas depict the standard deviation. The boxes indicate the 25–75th percentiles, whiskers show the maximum/minimum values within the standard deviation, the midline indicates the median and diamonds indicate outliers. Source data are provided as a Source Data file.

