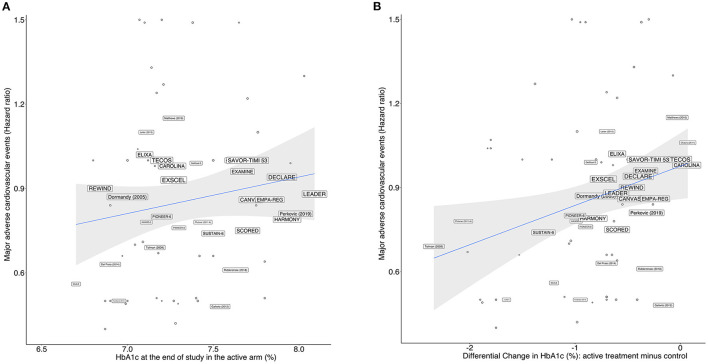
Figure 4.
Meta-regression model for all drugs showing the relationship between the HR for MACE vs.: (A) achieved HbA1c levels at study end in the active arms of each trial, and (B) differential change in HbA1c levels between active and control arms. The size of the trials' name corresponds to their proportional weights in the regression.

