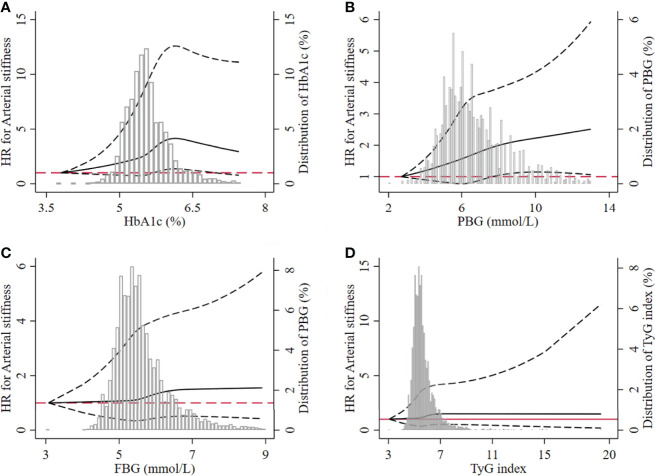
Figure 5.
Dose–response relationship between the four glucose parameters and the risk of arterial stiffness. (A) HbA1c, (B) PBG, (C) FBG, (D) TyG index. The dotted lines represented the lower and upper limit of 95% CI at each dot. HbA1c, glycated hemoglobin; PBG, postprandial blood glucose; FBG, fasting blood glucose; TyG index, triglyceride-glucose index; HR, hazard ratio.

