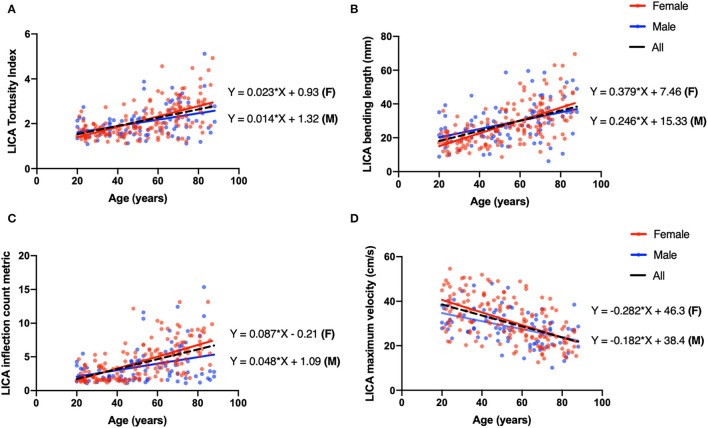
Figure 4.
Univariate linear regression plot of left ICA (LICA) as a representative vessel to show the coefficient difference between males (blue) and females (red). (A) The TI of LICA has a positive correlation with age (coeff = 0.018, P < 0.001, black dash line), and the linear correlation coefficients for males and females are 0.014 and 0.023, respectively. (B) Bending length (BL) of LICA is negatively correlated with age (coeff = 0.30, p < 0.001, black dash line), and the linear correlation coefficients for males and females are 0.246 and 0.379, respectively. (C) The ICM of LICA has significantly positive correlation with age (coeff = 0.072, p < 0.001, black dash line). The coefficients for males and females are 0.048 and 0.087. (D) The MaxV of LICA is negatively correlated with age (coeff = −0.247, p < 0.001, black dash line), and coefficients for males and females are −0.182 and −0.282.

